Migration
UK

The following table provides summary statistics for permanent job vacancies with a requirement for Migration skills. Included is a benchmarking guide to the salaries offered in vacancies that have cited Migration over the 6 months to 29 November 2023 with a comparison to the same period in the previous 2 years.

6 months to
29 Nov 2023
Same period 2022 Same period 2021
Rank 62 88 81
Rank change year-on-year +26 -7 -9
Permanent jobs citing Migration 2,427 4,662 5,181
As % of all permanent jobs advertised in the UK 4.49% 3.70% 4.01%
As % of the Processes & Methodologies category 4.77% 3.87% 4.21%
Number of salaries quoted 1,755 3,190 3,786
10th Percentile £42,500 £40,000 £37,500
25th Percentile £52,500 £51,250 £46,250
Median annual salary (50th Percentile) £65,000 £65,000 £62,725
Median % change year-on-year - +3.63% +9.09%
75th Percentile £80,000 £85,000 £82,500
90th Percentile £97,500 £102,500 £97,500
UK excluding London median annual salary £60,000 £57,500 £52,500
% change year-on-year +4.35% +9.52% +7.14%

All Process and Methodology Skills
UK

Migration is in the Processes and Methodologies category. The following table is for comparison with the above and provides summary statistics for all permanent job vacancies with a requirement for process or methodology skills.

Permanent vacancies with a requirement for process or methodology skills 50,908 120,439 123,182
As % of all permanent jobs advertised in the UK 94.09% 95.71% 95.44%
Number of salaries quoted 36,868 73,620 81,568
10th Percentile £32,500 £34,459 £32,500
25th Percentile £43,750 £45,000 £42,500
Median annual salary (50th Percentile) £60,000 £60,000 £59,045
Median % change year-on-year - +1.62% +7.35%
75th Percentile £80,000 £81,250 £77,500
90th Percentile £98,825 £100,000 £95,000
UK excluding London median annual salary £52,500 £53,000 £50,000
% change year-on-year -0.94% +6.00% +3.63%

Migration
Job Vacancy Trend

Job postings citing Migration as a proportion of all IT jobs advertised.
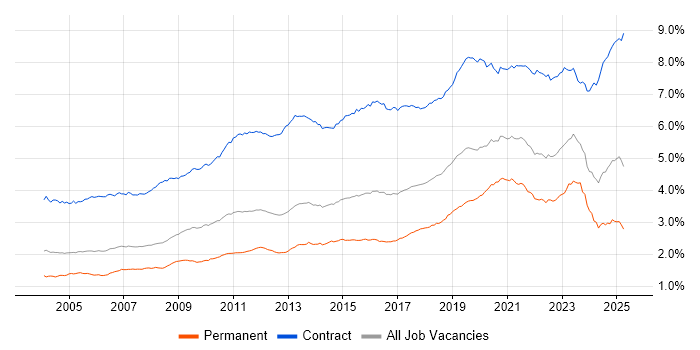
Job vacancy trend for Migration in the UK

Migration
Salary Trend

3-month moving average salary quoted in jobs citing Migration.

Salary trend for Migration in the UK

Migration
Salary Histogram

Salary distribution for jobs citing Migration over the 6 months to 29 November 2023.

Salary histogram for Migration in the UK

Migration
Top 18 Job Locations

The table below looks at the demand and provides a guide to the median salaries quoted in IT jobs citing Migration within the UK over the 6 months to 29 November 2023. The 'Rank Change' column provides an indication of the change in demand within each location based on the same 6 month period last year.

Location Rank Change
on Same Period
Last Year
Matching
Permanent
IT Job Ads
Median Salary
Past 6 Months
Median Salary
% Change
on Same Period
Last Year
Live
Jobs
England +25 2,114 £65,000 - 890
UK excluding London +42 1,286 £60,000 +4.35% 569
Work from Home +22 1,102 £60,249 -10.08% 486
London +27 920 £72,500 -6.45% 389
North of England +16 344 £60,000 +6.37% 150
South East +56 290 £55,000 -8.33% 185
Midlands +41 223 £60,000 +4.35% 97
North West +43 184 £65,000 +15.23% 74
South West +60 172 £60,000 +12.15% 65
West Midlands +38 163 £60,000 +4.35% 63
Yorkshire -7 135 £60,000 +4.35% 55
Scotland +51 109 £57,500 +4.55% 24
East of England +56 79 £57,500 -8.00% 54
East Midlands +33 59 £60,000 +9.09% 33
Wales -9 38 £70,000 +40.00% 14
Northern Ireland +14 26 £62,500 +47.06% 4
North East +12 26 £60,000 +50.00% 25
Isle of Man - 10 £60,000 -

Migration
Co-occurring Skills and Capabilities by Category

The follow tables expand on the table above by listing co-occurrences grouped by category. The same employment type, locality and period is covered with up to 20 co-occurrences shown in each of the following categories:

Application Platforms
1 148 (6.10%) SharePoint
2 67 (2.76%) Confluence
3 44 (1.81%) IIS
4 41 (1.69%) MS Exchange
5 30 (1.24%) WebSphere
6 23 (0.95%) Apache Spark
6 23 (0.95%) Captiva
6 23 (0.95%) FileNet
7 15 (0.62%) Apache
7 15 (0.62%) NetWeaver
8 12 (0.49%) WordPress
9 9 (0.37%) SAS
10 7 (0.29%) CMS
10 7 (0.29%) SharePoint Server
11 6 (0.25%) nginx
12 5 (0.21%) IBM HTTP Server
13 4 (0.16%) ArcGIS
13 4 (0.16%) ArcSDE
13 4 (0.16%) Documentum
13 4 (0.16%) Oracle Workflow
Applications
1 56 (2.31%) Microsoft Excel
2 47 (1.94%) Microsoft Office
3 14 (0.58%) Microsoft PowerPoint
4 8 (0.33%) AutoCAD
4 8 (0.33%) InfoPath
4 8 (0.33%) PTC Creo
4 8 (0.33%) SOLIDWORKS
4 8 (0.33%) Spreadsheet
5 7 (0.29%) MS Visio
6 4 (0.16%) Autodesk Inventor
6 4 (0.16%) Microsoft Project
7 3 (0.12%) Chatbot
8 2 (0.082%) Trello
Business Applications
1 104 (4.29%) Hyperion Planning
2 66 (2.72%) Dynamics CRM
3 53 (2.18%) NetSuite
4 52 (2.14%) SAP S/4HANA
5 14 (0.58%) Dynamics NAV
6 11 (0.45%) Oracle EBS
7 10 (0.41%) SAP ERP
8 9 (0.37%) SAP CO
8 9 (0.37%) SAP FI
8 9 (0.37%) SAP FI/CO
9 8 (0.33%) Unit4 Business World
10 6 (0.25%) BusinessWorks
10 6 (0.25%) Oracle ERP
10 6 (0.25%) SAP SD
11 5 (0.21%) Aladdin
11 5 (0.21%) Bloomberg AIM
11 5 (0.21%) Dynamics AX
11 5 (0.21%) Sage X3
11 5 (0.21%) Salesforce CRM
11 5 (0.21%) SimCorp Dimension
Cloud Services
1 891 (36.71%) Azure
2 525 (21.63%) AWS
3 306 (12.61%) Microsoft 365
4 233 (9.60%) GCP
5 218 (8.98%) Power Platform
6 169 (6.96%) SaaS
7 144 (5.93%) Azure DevOps
8 125 (5.15%) IaaS
9 119 (4.90%) PaaS
10 113 (4.66%) Entra ID
11 111 (4.57%) Dynamics 365
12 91 (3.75%) Azure Data Factory
13 77 (3.17%) PowerApps
14 75 (3.09%) Serverless
15 72 (2.97%) Power Automate
16 58 (2.39%) GitHub
17 53 (2.18%) Cloud Computing
18 43 (1.77%) Azure Logic Apps
19 41 (1.69%) OneDrive
20 38 (1.57%) Azure Synapse Analytics
Communications & Networking
1 134 (5.52%) Firewall
2 104 (4.29%) DNS
3 85 (3.50%) VPN
4 82 (3.38%) WAN
5 80 (3.30%) DHCP
6 78 (3.21%) Wireless
7 65 (2.68%) LAN
8 40 (1.65%) SD-WAN
9 39 (1.61%) Network Security
10 35 (1.44%) VLAN
11 34 (1.40%) SAN
12 27 (1.11%) Wi-Fi
13 20 (0.82%) TCP/IP
14 17 (0.70%) MPLS
15 16 (0.66%) BGP
16 15 (0.62%) Cisco Nexus
16 15 (0.62%) NAS
17 14 (0.58%) HTTP
18 13 (0.54%) OSPF
19 12 (0.49%) Internet
Database & Business Intelligence
1 243 (10.01%) SQL Server
2 163 (6.72%) Data Warehouse
3 158 (6.51%) Power BI
4 99 (4.08%) PostgreSQL
5 96 (3.96%) Oracle Database
6 91 (3.75%) Oracle Database 11g
7 85 (3.50%) SQL Server Integration Services
8 73 (3.01%) Data Lake
9 46 (1.90%) SQL Server Reporting Services
10 44 (1.81%) Azure SQL Database
11 40 (1.65%) Relational Database
12 38 (1.57%) Metadata
13 31 (1.28%) Big Data
14 28 (1.15%) Elasticsearch
14 28 (1.15%) Hadoop
15 25 (1.03%) SQL Server Analysis Services
16 24 (0.99%) MySQL
17 23 (0.95%) Oracle Database 10g
18 22 (0.91%) NoSQL
19 21 (0.87%) Oracle Database 12c
Development Applications
1 121 (4.99%) Jenkins
2 117 (4.82%) JIRA
3 75 (3.09%) Git
4 41 (1.69%) Bitbucket
5 34 (1.40%) Gradle
6 29 (1.19%) GitLab
6 29 (1.19%) Oracle Forms
7 28 (1.15%) Team Foundation Server
8 26 (1.07%) Spinnaker
9 25 (1.03%) Visual Studio
10 23 (0.95%) TeamCity
11 20 (0.82%) Sonatype Nexus
12 19 (0.78%) Selenium
13 18 (0.74%) MSI
14 17 (0.70%) AdminStudio
14 17 (0.70%) InstallShield
15 15 (0.62%) Atlassian Bamboo
15 15 (0.62%) SonarQube
15 15 (0.62%) SQL Server Management Studio (SSMS)
16 13 (0.54%) Octopus Deploy
General
1 758 (31.23%) Finance
2 583 (24.02%) Social Skills
3 194 (7.99%) Banking
4 168 (6.92%) Analytical Skills
5 101 (4.16%) Inclusion and Diversity
5 101 (4.16%) Retail
6 100 (4.12%) Public Sector
7 95 (3.91%) Manufacturing
8 62 (2.55%) Legal
9 55 (2.27%) Marketing
10 45 (1.85%) Investment Banking
11 43 (1.77%) Organisational Skills
11 43 (1.77%) Telecoms
12 40 (1.65%) Law
12 40 (1.65%) Presentation Skills
13 34 (1.40%) Back Office
14 32 (1.32%) Documentation Skills
15 29 (1.19%) Influencing Skills
16 28 (1.15%) Financial Institution
17 27 (1.11%) Aerospace
Job Titles
1 453 (18.67%) Senior
2 341 (14.05%) Consultant
3 296 (12.20%) Architect
4 261 (10.75%) Developer
5 213 (8.78%) Project Manager
6 166 (6.84%) Analyst
6 166 (6.84%) Lead
7 118 (4.86%) Oracle Consultant
8 114 (4.70%) Senior Manager
9 110 (4.53%) DevOps Engineer
9 110 (4.53%) Senior Project Manager
10 99 (4.08%) Azure Engineer
10 99 (4.08%) Infrastructure Engineer
11 90 (3.71%) Senior Developer
12 81 (3.34%) Cloud Engineer
13 80 (3.30%) Data Engineer
14 75 (3.09%) Solutions Architect
15 74 (3.05%) Administrator
16 71 (2.93%) Functional Consultant
17 70 (2.88%) Data Architect
Libraries, Frameworks & Software Standards
1 130 (5.36%) .NET
2 53 (2.18%) HTML
3 45 (1.85%) Spring
4 42 (1.73%) React
5 41 (1.69%) REST
6 40 (1.65%) Kafka
7 39 (1.61%) CSS
8 38 (1.57%) Spring Boot
9 34 (1.40%) .NET Framework
9 34 (1.40%) AngularJS
9 34 (1.40%) Micronaut
10 33 (1.36%) JSON
11 30 (1.24%) Web Services
11 30 (1.24%) XML
12 29 (1.19%) SOAP
13 27 (1.11%) YAML
14 26 (1.07%) ASP.NET
14 26 (1.07%) RESTful
15 21 (0.87%) ARM Templates
16 20 (0.82%) HTML5
Miscellaneous
1 188 (7.75%) Management Information System
2 141 (5.81%) Data Centre
3 127 (5.23%) Virtual Team
4 109 (4.49%) Legacy Systems
5 90 (3.71%) Public Cloud
6 84 (3.46%) Enterprise Software
7 77 (3.17%) Self-Motivation
8 65 (2.68%) Cloud Native
9 61 (2.51%) Product Ownership
10 55 (2.27%) Onboarding
11 53 (2.18%) Replication
12 51 (2.10%) Hybrid Cloud
13 44 (1.81%) Greenfield Project
14 39 (1.61%) Private Cloud
15 30 (1.24%) Data Structures
16 23 (0.95%) DataPower
17 20 (0.82%) Mainframe
18 19 (0.78%) Life Science
19 18 (0.74%) Legacy Applications
19 18 (0.74%) PKI
Operating Systems
1 313 (12.90%) Windows
2 175 (7.21%) Windows Server
3 139 (5.73%) Linux
4 53 (2.18%) Windows 10
5 45 (1.85%) Unix
6 39 (1.61%) Red Hat Enterprise Linux
6 39 (1.61%) Windows Server 2012
7 34 (1.40%) Solaris
8 30 (1.24%) Windows Server 2016
9 25 (1.03%) Windows 7
9 25 (1.03%) Windows Server 2019
10 19 (0.78%) Apple iOS
11 16 (0.66%) HPUX
12 15 (0.62%) CentOS
13 10 (0.41%) Android
13 10 (0.41%) Windows Server 2008
14 9 (0.37%) VMS
15 6 (0.25%) Windows 8
16 2 (0.082%) Mac OS X
16 2 (0.082%) Ubuntu
Processes & Methodologies
1 568 (23.40%) Data Migration
2 562 (23.16%) Agile
3 435 (17.92%) DevOps
4 353 (14.54%) Problem-Solving
5 314 (12.94%) Project Management
6 293 (12.07%) Project Delivery
7 278 (11.45%) Actionable Insight
8 274 (11.29%) ERP
9 235 (9.68%) CI/CD
10 224 (9.23%) Business Intelligence
11 206 (8.49%) Roadmaps
12 203 (8.36%) Stakeholder Management
13 185 (7.62%) Scrum
14 173 (7.13%) Computer Science
15 170 (7.00%) ITIL
15 170 (7.00%) Mentoring
16 165 (6.80%) SDLC
17 164 (6.76%) Data Modelling
18 162 (6.67%) Analytics
19 160 (6.59%) CRM
Programming Languages
1 595 (24.52%) SQL
2 224 (9.23%) PowerShell
3 194 (7.99%) Python
4 191 (7.87%) Java
5 184 (7.58%) C#
6 116 (4.78%) JavaScript
7 88 (3.63%) PL/SQL
8 72 (2.97%) Bash
9 67 (2.76%) T-SQL
10 46 (1.90%) Groovy
11 45 (1.85%) PHP
12 33 (1.36%) Go
13 28 (1.15%) TypeScript
14 24 (0.99%) VB
15 23 (0.95%) ABAP
15 23 (0.95%) Perl
16 22 (0.91%) Scala
17 17 (0.70%) Bicep
18 15 (0.62%) Apex Code
19 13 (0.54%) Shell Script
Qualifications
1 321 (13.23%) Degree
2 198 (8.16%) Security Cleared
3 157 (6.47%) Computer Science Degree
4 146 (6.02%) SC Cleared
5 59 (2.43%) Microsoft Certification
6 47 (1.94%) Azure Certification
7 42 (1.73%) AWS Certification
8 37 (1.52%) Cisco Certification
9 30 (1.24%) DV Cleared
10 27 (1.11%) MCSE
11 26 (1.07%) CCNP
12 23 (0.95%) Master's Degree
13 21 (0.87%) DBS Check
14 20 (0.82%) MCSA
15 15 (0.62%) BPSS Clearance
16 13 (0.54%) CCNA
17 12 (0.49%) AWS Certified Solutions Architect
18 11 (0.45%) CISSP
19 10 (0.41%) GSEC
19 10 (0.41%) ITIL Certification
Quality Assurance & Compliance
1 120 (4.94%) Data Quality
2 52 (2.14%) QA
3 41 (1.69%) GDPR
4 33 (1.36%) NIST
5 24 (0.99%) Accessibility
5 24 (0.99%) ISO/IEC 27001
6 20 (0.82%) SLA
7 17 (0.70%) PMO
8 8 (0.33%) Cyber Essentials
9 6 (0.25%) COBIT
9 6 (0.25%) NCSC
10 4 (0.16%) GRC
10 4 (0.16%) HL7
11 3 (0.12%) Cyber Essentials PLUS
12 2 (0.082%) ISO/IEC 20000
13 1 (0.041%) GAAP
13 1 (0.041%) IASME
13 1 (0.041%) JSP 440
13 1 (0.041%) PCI DSS
13 1 (0.041%) WCAG
System Software
1 245 (10.09%) Active Directory
2 153 (6.30%) Docker
3 129 (5.32%) VMware Infrastructure
4 93 (3.83%) Hyper-V
5 34 (1.40%) Virtual Machines
6 31 (1.28%) Virtual Desktop
7 27 (1.11%) VMware ESXi
8 17 (0.70%) Microsoft App-V
9 14 (0.58%) XenApp
10 12 (0.49%) vSphere
11 6 (0.25%) BitLocker
11 6 (0.25%) DFS Replication
11 6 (0.25%) Firmware
12 5 (0.21%) XenDesktop
13 4 (0.16%) FreeRADIUS
13 4 (0.16%) VMware NSX
14 3 (0.12%) IAG
15 2 (0.082%) Ceph
15 2 (0.082%) HDFS
15 2 (0.082%) Postfix
Systems Management
1 200 (8.24%) Terraform
2 191 (7.87%) Kubernetes
3 80 (3.30%) SCCM
4 76 (3.13%) Microsoft Intune
5 71 (2.93%) Ansible
6 22 (0.91%) SCOM
7 21 (0.87%) Active Directory Federation Services
7 21 (0.87%) WSUS
8 20 (0.82%) Istio
8 20 (0.82%) Puppet
9 19 (0.78%) Grafana
10 18 (0.74%) Argo
10 18 (0.74%) Rancher
11 16 (0.66%) Progress Chef
12 13 (0.54%) AirWatch
13 12 (0.49%) Single Sign-On
14 10 (0.41%) FortiGate
15 9 (0.37%) Nagios
16 8 (0.33%) vCenter Server
17 7 (0.29%) Prometheus
Vendors
1 644 (26.53%) Microsoft
2 339 (13.97%) Oracle
3 204 (8.41%) Salesforce
4 191 (7.87%) SAP
5 182 (7.50%) VMware
6 109 (4.49%) NEC
7 104 (4.29%) Hyperion
8 92 (3.79%) Google
9 79 (3.26%) Cisco
10 78 (3.21%) ServiceNow
11 73 (3.01%) IBM
12 59 (2.43%) Atlassian
13 46 (1.90%) Databricks
14 41 (1.69%) HP
15 37 (1.52%) Palo Alto
16 36 (1.48%) Sage
17 33 (1.36%) Citrix
18 30 (1.24%) Pardot
18 30 (1.24%) SolarWinds
18 30 (1.24%) Talend