Network Architect
UK
The median Network Architect salary in the UK is £67,500 per year, according to job vacancies posted during the 6 months leading to 30 May 2025.
The table below provides salary benchmarking and summary statistics, comparing them to the same period in the previous two years.
| 6 months to 30 May 2025 |
Same period 2024 | Same period 2023 | |
|---|---|---|---|
| Rank | 558 | 774 | 786 |
| Rank change year-on-year | +216 | +12 | +154 |
| Permanent jobs requiring a Network Architect | 153 | 138 | 176 |
| As % of all permanent jobs advertised in the UK | 0.28% | 0.13% | 0.18% |
| As % of the Job Titles category | 0.31% | 0.14% | 0.20% |
| Number of salaries quoted | 122 | 102 | 110 |
| 10th Percentile | £56,250 | £52,350 | £61,250 |
| 25th Percentile | £62,500 | £62,125 | £65,000 |
| Median annual salary (50th Percentile) | £67,500 | £70,000 | £70,000 |
| Median % change year-on-year | -3.57% | - | -15.15% |
| 75th Percentile | £83,750 | £84,964 | £84,375 |
| 90th Percentile | £90,750 | £95,000 | £85,000 |
| UK excluding London median annual salary | £65,000 | £69,000 | £65,000 |
| % change year-on-year | -5.80% | +6.15% | -7.14% |
All Permanent IT Job Vacancies
UK
For comparison with the information above, the following table provides summary statistics for all permanent IT job vacancies. Most job vacancies include a discernible job title that can be normalized. As such, the figures in the second row provide an indication of the number of permanent jobs in our overall sample.
| Permanent vacancies in the UK with a recognized job title | 50,066 | 97,923 | 88,829 |
| % of permanent jobs with a recognized job title | 90.36% | 94.81% | 91.43% |
| Number of salaries quoted | 26,124 | 69,761 | 56,179 |
| 10th Percentile | £28,750 | £28,500 | £32,500 |
| 25th Percentile | £40,750 | £38,500 | £45,000 |
| Median annual salary (50th Percentile) | £55,000 | £52,500 | £60,000 |
| Median % change year-on-year | +4.76% | -12.50% | - |
| 75th Percentile | £73,750 | £70,000 | £80,000 |
| 90th Percentile | £95,000 | £90,000 | £100,000 |
| UK excluding London median annual salary | £51,000 | £50,000 | £53,500 |
| % change year-on-year | +2.00% | -6.54% | +6.63% |
Network Architect
Job Vacancy Trend
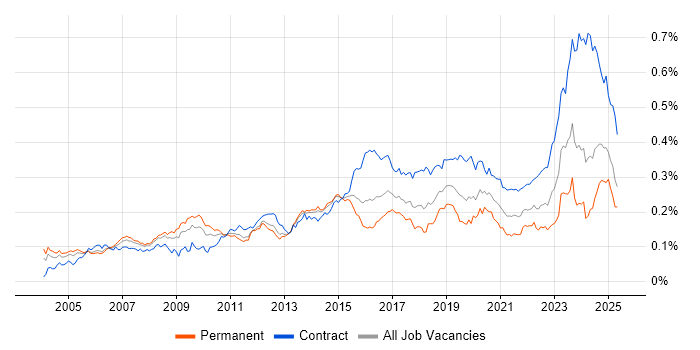
Job postings that featured Network Architect in the job title as a proportion of all IT jobs advertised.

Network Architect
Salary Trend
3-month moving average salary quoted in jobs citing Network Architect.
Network Architect
Salary Histogram
Salary distribution for jobs citing Network Architect over the 6 months to 30 May 2025.
Network Architect
Top 15 Job Locations
The table below looks at the demand and provides a guide to the median salaries quoted in IT jobs citing Network Architect within the UK over the 6 months to 30 May 2025. The 'Rank Change' column provides an indication of the change in demand within each location based on the same 6 month period last year.
| Location | Rank Change on Same Period Last Year |
Matching Permanent IT Job Ads |
Median Salary Past 6 Months |
Median Salary % Change on Same Period Last Year |
Live Jobs |
|---|---|---|---|---|---|
| England | +166 | 138 | £66,500 | -3.62% | 272 |
| UK excluding London | +199 | 113 | £65,000 | -5.80% | 275 |
| Midlands | +127 | 48 | £65,000 | - | 57 |
| West Midlands | +99 | 48 | £65,000 | - | 34 |
| South East | +63 | 39 | £65,000 | -7.14% | 76 |
| Work from Home | +85 | 15 | £71,250 | -5.00% | 99 |
| London | +107 | 13 | £90,000 | +20.00% | 22 |
| North of England | +38 | 12 | £62,500 | -3.85% | 54 |
| North West | +3 | 10 | £62,500 | +4.17% | 22 |
| East of England | +52 | 7 | £57,500 | -11.88% | 40 |
| Northern Ireland | - | 3 | £110,000 | - | 3 |
| Scotland | - | 3 | - | - | 9 |
| Yorkshire | +54 | 2 | - | - | 25 |
| North East | +47 | 2 | - | - | 8 |
| South West | +97 | 1 | - | - | 40 |
Network Architect Skill Set
Top 30 Co-occurring Skills and Capabilities
For the 6 months to 30 May 2025, Network Architect job roles required the following skills and capabilities in order of popularity. The figures indicate the absolute number co-occurrences and as a proportion of all permanent job ads featuring Network Architect in the job title.
|
|
Network Architect Skill Set
Co-occurring Skills and Capabilities by Category
The follow tables expand on the table above by listing co-occurrences grouped by category. The same employment type, locality and period is covered with up to 20 co-occurrences shown in each of the following categories:
|
|
|||||||||||||||||||||||||||||||||||||||||||||||||||||||||||||||||||||||||||||||||||||||||||||||||||||||||||||||
|
|
|||||||||||||||||||||||||||||||||||||||||||||||||||||||||||||||||||||||||||||||||||||||||||||||||||||||||||||||
|
|
|||||||||||||||||||||||||||||||||||||||||||||||||||||||||||||||||||||||||||||||||||||||||||||||||||||||||||||||
|
|
|||||||||||||||||||||||||||||||||||||||||||||||||||||||||||||||||||||||||||||||||||||||||||||||||||||||||||||||
|
|
|||||||||||||||||||||||||||||||||||||||||||||||||||||||||||||||||||||||||||||||||||||||||||||||||||||||||||||||
|
|
|||||||||||||||||||||||||||||||||||||||||||||||||||||||||||||||||||||||||||||||||||||||||||||||||||||||||||||||
|
|
|||||||||||||||||||||||||||||||||||||||||||||||||||||||||||||||||||||||||||||||||||||||||||||||||||||||||||||||
|
|
|||||||||||||||||||||||||||||||||||||||||||||||||||||||||||||||||||||||||||||||||||||||||||||||||||||||||||||||
|
||||||||||||||||||||||||||||||||||||||||||||||||||||||||||||||||||||||||||||||||||||||||||||||||||||||||||||||||
