Change Control Jobs

Change Control
UK

The table below provides summary statistics for permanent job vacancies requiring Change Control skills. It includes a benchmarking guide to the annual salaries offered in vacancies that cited Change Control over the 6 months leading up to 8 June 2025, comparing them to the same period in the previous two years.

6 months to
8 Jun 2025
Same period 2024 Same period 2023
Rank 478 395 389
Rank change year-on-year -83 -6 +34
Permanent jobs citing Change Control 248 666 792
As % of all permanent jobs advertised in the UK 0.44% 0.62% 0.85%
As % of the Processes & Methodologies category 0.47% 0.74% 0.89%
Number of salaries quoted 167 456 514
10th Percentile £37,500 £33,750 £35,575
25th Percentile £46,250 £40,988 £42,063
Median annual salary (50th Percentile) £55,000 £50,000 £55,000
Median % change year-on-year +10.00% -9.09% -
75th Percentile £65,000 £60,741 £70,000
90th Percentile £73,750 £77,500 £85,000
UK excluding London median annual salary £54,793 £47,500 £49,000
% change year-on-year +15.35% -3.06% -2.00%

All Process and Methodology Skills
UK

Change Control falls under the Processes and Methodologies category. For comparison with the information above, the following table provides summary statistics for all permanent job vacancies requiring process or methodology skills.

Permanent vacancies with a requirement for process or methodology skills 52,589 89,609 89,464
As % of all permanent jobs advertised in the UK 93.19% 83.05% 95.46%
Number of salaries quoted 26,249 62,082 54,033
10th Percentile £28,500 £29,500 £33,950
25th Percentile £40,584 £40,000 £45,000
Median annual salary (50th Percentile) £56,000 £55,000 £60,800
Median % change year-on-year +1.82% -9.54% +1.33%
75th Percentile £74,445 £72,500 £81,250
90th Percentile £97,236 £92,500 £100,000
UK excluding London median annual salary £51,000 £50,000 £55,000
% change year-on-year +2.00% -9.09% +4.76%

Change Control
Job Vacancy Trend

Job postings citing Change Control as a proportion of all IT jobs advertised.
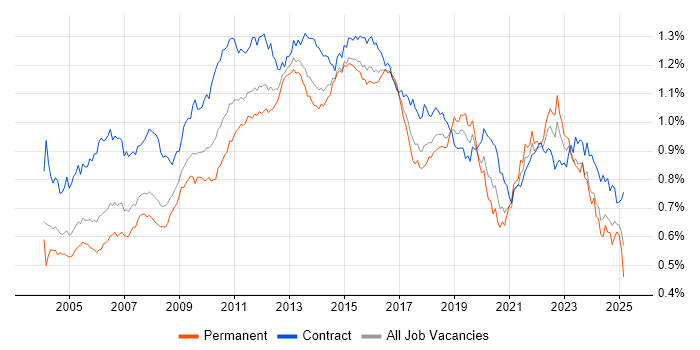
Job vacancy trend for Change Control in the UK

Change Control
Salary Trend

3-month moving average salary quoted in jobs citing Change Control.

Salary trend for Change Control in the UK

Change Control
Salary Histogram

Salary distribution for jobs citing Change Control over the 6 months to 8 June 2025.

Salary histogram for Change Control in the UK

Change Control
Top 17 Job Locations

The table below looks at the demand and provides a guide to the median salaries quoted in IT jobs citing Change Control within the UK over the 6 months to 8 June 2025. The 'Rank Change' column provides an indication of the change in demand within each location based on the same 6 month period last year.

Location Rank Change
on Same Period
Last Year
Matching
Permanent
IT Job Ads
Median Salary
Past 6 Months
Median Salary
% Change
on Same Period
Last Year
Live
Jobs
England -97 223 £55,000 +10.00% 414
UK excluding London -68 171 £54,793 +15.35% 337
Work from Home +23 69 £50,000 - 184
London +46 62 £59,000 -12.59% 148
South East +5 56 £42,500 -9.57% 153
North of England -31 37 £54,793 +9.59% 61
Midlands -9 32 £55,000 +15.79% 39
North West -39 25 £65,000 +44.44% 41
West Midlands +21 24 £55,000 +21.77% 31
South West +96 15 £53,750 +16.22% 25
East of England +4 15 £63,908 +59.77% 19
Scotland +94 13 £50,445 +0.89% 13
Yorkshire +52 10 £52,397 +9.73% 17
East Midlands -3 8 £52,500 +9.38% 7
Wales +36 3 £42,500 - 23
Northern Ireland +44 2 - - 14
North East +9 2 £33,198 -33.61% 3

Change Control
Co-occurring Skills and Capabilities by Category

The follow tables expand on the table above by listing co-occurrences grouped by category. The same employment type, locality and period is covered with up to 20 co-occurrences shown in each of the following categories:

Application Platforms
1 17 (6.85%) Microsoft Exchange
2 15 (6.05%) SharePoint
3 5 (2.02%) Apache
3 5 (2.02%) Confluence
4 4 (1.61%) BizTalk Server
5 3 (1.21%) WordPress
6 2 (0.81%) nginx
7 1 (0.40%) IIS
7 1 (0.40%) OpenStack
Applications
1 27 (10.89%) Microsoft Office
2 20 (8.06%) Microsoft Excel
3 11 (4.44%) MS Visio
4 10 (4.03%) Microsoft Project
5 9 (3.63%) Microsoft PowerPoint
6 1 (0.40%) Spreadsheet
6 1 (0.40%) Trello
Business Applications
1 10 (4.03%) TrackWise
2 4 (1.61%) Dynamics CRM
3 3 (1.21%) SAP S/4HANA
4 2 (0.81%) SimCorp Dimension
5 1 (0.40%) NetSuite
5 1 (0.40%) SAP MM
5 1 (0.40%) SAP PLM
Cloud Services
1 45 (18.15%) Azure
2 19 (7.66%) Microsoft 365
3 17 (6.85%) AWS
4 13 (5.24%) Power Platform
4 13 (5.24%) SaaS
5 12 (4.84%) Dynamics 365
6 10 (4.03%) IaaS
6 10 (4.03%) PaaS
6 10 (4.03%) Veeva
7 7 (2.82%) Cloud Computing
7 7 (2.82%) Entra ID
8 5 (2.02%) Amazon S3
8 5 (2.02%) Azure DevOps
9 4 (1.61%) Amazon EC2
9 4 (1.61%) Azure Service Bus
9 4 (1.61%) Google Workspace
9 4 (1.61%) Microsoft Copilot
9 4 (1.61%) Power Automate
10 3 (1.21%) Azure Logic Apps
10 3 (1.21%) Slack
Communications & Networking
1 33 (13.31%) Firewall
2 17 (6.85%) LAN
3 14 (5.65%) DNS
3 14 (5.65%) Network Security
4 12 (4.84%) DHCP
5 11 (4.44%) SAN
6 10 (4.03%) Intrusion Detection
6 10 (4.03%) WAN
7 9 (3.63%) NAS
8 7 (2.82%) VLAN
9 6 (2.42%) Wi-Fi
10 5 (2.02%) Ethernet VPN
10 5 (2.02%) Wireless
11 3 (1.21%) Internet
11 3 (1.21%) SSL
11 3 (1.21%) VPN
12 2 (0.81%) FTP
12 2 (0.81%) IPv4
12 2 (0.81%) SMTP
12 2 (0.81%) TCP/IP
Database & Business Intelligence
1 10 (4.03%) Power BI
2 8 (3.23%) SQL Server
3 4 (1.61%) Tableau
4 3 (1.21%) Big Data
4 3 (1.21%) Crystal Reports
4 3 (1.21%) Relational Database
5 2 (0.81%) Amazon Athena
5 2 (0.81%) Amazon Aurora
5 2 (0.81%) Amazon RDS
5 2 (0.81%) Amazon Redshift
5 2 (0.81%) Data Warehouse
5 2 (0.81%) EDMS
5 2 (0.81%) Flink
5 2 (0.81%) SAP HANA
5 2 (0.81%) SQL Server Reporting Services
6 1 (0.40%) Metadata
6 1 (0.40%) Parquet
6 1 (0.40%) SQL Server Integration Services
6 1 (0.40%) SSDT
Development Applications
1 13 (5.24%) JIRA
2 5 (2.02%) Jenkins
3 4 (1.61%) Git
4 3 (1.21%) JUnit
5 2 (0.81%) GitLab
5 2 (0.81%) Selenium
5 2 (0.81%) Sonatype Nexus
5 2 (0.81%) TestNG
6 1 (0.40%) Ant
6 1 (0.40%) Bitbucket
6 1 (0.40%) Cucumber
6 1 (0.40%) SonarQube
6 1 (0.40%) TeamCity
General
1 92 (37.10%) Finance
2 75 (30.24%) Social Skills
3 25 (10.08%) Analytical Skills
4 21 (8.47%) Banking
5 20 (8.06%) Telecoms
6 17 (6.85%) Law
7 15 (6.05%) Manufacturing
8 14 (5.65%) Organisational Skills
8 14 (5.65%) Pharmaceutical
9 13 (5.24%) Retail
10 10 (4.03%) Documentation Skills
11 8 (3.23%) Public Sector
12 6 (2.42%) Inclusion and Diversity
13 5 (2.02%) Financial Institution
13 5 (2.02%) Legal
14 4 (1.61%) Aerospace
14 4 (1.61%) Automotive
14 4 (1.61%) Military
15 3 (1.21%) Electronics
15 3 (1.21%) Marketing
Job Titles
1 45 (18.15%) Project Manager
2 29 (11.69%) Analyst
3 27 (10.89%) Lead
4 25 (10.08%) Senior
5 19 (7.66%) Network Engineer
6 17 (6.85%) Developer
6 17 (6.85%) Support Engineer
7 16 (6.45%) Delivery Project Manager
7 16 (6.45%) Infrastructure Engineer
7 16 (6.45%) IT Engineer
8 13 (5.24%) IT Support
8 13 (5.24%) IT Support Engineer
9 8 (3.23%) IT Infrastructure Engineer
10 7 (2.82%) Administrator
10 7 (2.82%) Consultant
10 7 (2.82%) Infrastructure Support
10 7 (2.82%) Infrastructure Support Engineer
10 7 (2.82%) Senior Manager
10 7 (2.82%) Systems Administrator
11 6 (2.42%) IT Manager
Libraries, Frameworks & Software Standards
1 6 (2.42%) .NET
1 6 (2.42%) RESTful
2 4 (1.61%) HTML
2 4 (1.61%) LDAP
3 3 (1.21%) .NET Framework
3 3 (1.21%) 802.1X
3 3 (1.21%) AngularJS
3 3 (1.21%) ASP.NET
3 3 (1.21%) Spring
3 3 (1.21%) Spring Boot
4 2 (0.81%) boto
4 2 (0.81%) FastAPI
4 2 (0.81%) GraphQL
4 2 (0.81%) JSON
4 2 (0.81%) Kafka
4 2 (0.81%) Middleware
4 2 (0.81%) OpenAPI
4 2 (0.81%) SAML
4 2 (0.81%) Swagger
4 2 (0.81%) XML
Miscellaneous
1 20 (8.06%) Data Centre
1 20 (8.06%) Management Information System
2 16 (6.45%) Onboarding
3 10 (4.03%) Private Cloud
4 9 (3.63%) Driving Licence
5 8 (3.23%) Clustering
6 5 (2.02%) Hedge funds
6 5 (2.02%) Life Science
7 4 (1.61%) Analogue Electronics
7 4 (1.61%) CCTV
7 4 (1.61%) PMI
7 4 (1.61%) Product Ownership
7 4 (1.61%) Self-Motivation
7 4 (1.61%) Virtual Team
8 3 (1.21%) Housing Association
8 3 (1.21%) iPad
8 3 (1.21%) iPhone
8 3 (1.21%) Legacy Systems
8 3 (1.21%) Renewable Energy
9 2 (0.81%) Social Media
Operating Systems
1 59 (23.79%) Windows
2 26 (10.48%) Linux
3 17 (6.85%) Windows Server
4 7 (2.82%) Windows 10
5 5 (2.02%) Android
6 4 (1.61%) Windows Server 2019
7 3 (1.21%) Mac OS
8 2 (0.81%) Red Hat Enterprise Linux
9 1 (0.40%) Apple iOS
9 1 (0.40%) Unix
9 1 (0.40%) Windows Server 2016
9 1 (0.40%) Windows Vista
Processes & Methodologies
1 78 (31.45%) Project Management
2 61 (24.60%) Problem-Solving
3 44 (17.74%) Project Delivery
4 41 (16.53%) Stakeholder Management
5 35 (14.11%) Agile
5 35 (14.11%) Continuous Improvement
6 33 (13.31%) Change Management
7 31 (12.50%) Risk Management
8 28 (11.29%) ITIL
9 27 (10.89%) Customer Service
10 24 (9.68%) Service Delivery
11 23 (9.27%) Workflow
12 22 (8.87%) DevOps
13 20 (8.06%) Kalman Filter
14 19 (7.66%) Business Case
15 18 (7.26%) CI/CD
15 18 (7.26%) Collaborative Working
16 17 (6.85%) Infrastructure Engineering
16 17 (6.85%) Supplier Management
17 16 (6.45%) Incident Management
Programming Languages
1 33 (13.31%) PowerShell
2 32 (12.90%) Python
3 24 (9.68%) Bash
4 20 (8.06%) SQL
5 16 (6.45%) C#
6 9 (3.63%) Java
7 4 (1.61%) JavaScript
7 4 (1.61%) VBA
8 3 (1.21%) Progress 4GL
9 1 (0.40%) Apex Code
9 1 (0.40%) SAPscript
Qualifications
1 50 (20.16%) Degree
2 23 (9.27%) BPSS Clearance
2 23 (9.27%) Security Cleared
3 19 (7.66%) Cisco Certification
4 16 (6.45%) APMP
5 12 (4.84%) SC Cleared
6 11 (4.44%) HND
6 11 (4.44%) Microsoft Certification
7 10 (4.03%) CCNP
8 9 (3.63%) CCNA
8 9 (3.63%) DV Cleared
9 5 (2.02%) Check Point Certification
9 5 (2.02%) MCSA
9 5 (2.02%) PMI Certification
10 3 (1.21%) Azure Certification
10 3 (1.21%) CISSP
10 3 (1.21%) PMP
11 2 (0.81%) Computer Science Degree
11 2 (0.81%) HNC
11 2 (0.81%) MCSE
Quality Assurance & Compliance
1 25 (10.08%) QA
2 15 (6.05%) ISO/IEC 27001
2 15 (6.05%) SLA
3 13 (5.24%) GMP
3 13 (5.24%) PMO
4 10 (4.03%) COBIT
5 5 (2.02%) Data Quality
6 4 (1.61%) Accessibility
6 4 (1.61%) ISO 9001
6 4 (1.61%) PCI DSS
7 2 (0.81%) GDPR
7 2 (0.81%) GxP
7 2 (0.81%) Sarbanes-Oxley
8 1 (0.40%) AICPA
8 1 (0.40%) GRC
8 1 (0.40%) MiFID
8 1 (0.40%) SOC 2
8 1 (0.40%) Software Quality Assurance
System Software
1 39 (15.73%) Active Directory
2 22 (8.87%) VMware Infrastructure
3 6 (2.42%) Firmware
3 6 (2.42%) Hyper-V
3 6 (2.42%) Virtual Desktop
3 6 (2.42%) Virtual Machines
4 5 (2.02%) VMware ESXi
5 2 (0.81%) vSphere
6 1 (0.40%) Docker
6 1 (0.40%) NFS
6 1 (0.40%) vCloud
6 1 (0.40%) Virtual Servers
Systems Management
1 6 (2.42%) WSUS
2 5 (2.02%) Ansible
2 5 (2.02%) Terraform
2 5 (2.02%) vCenter Server
3 3 (1.21%) Kubernetes
3 3 (1.21%) SCCM
3 3 (1.21%) Single Sign-On
4 2 (0.81%) Autotask
4 2 (0.81%) Failover Clustering
4 2 (0.81%) Graylog
4 2 (0.81%) Nagios
4 2 (0.81%) Puppet
4 2 (0.81%) Rundeck
5 1 (0.40%) FortiGate
5 1 (0.40%) Microsoft Clustering
5 1 (0.40%) PowerCLI
5 1 (0.40%) Progress Chef
5 1 (0.40%) SCOM
5 1 (0.40%) vRealize
Vendors
1 80 (32.26%) Microsoft
2 31 (12.50%) Cisco
3 25 (10.08%) SAP
3 25 (10.08%) VMware
4 11 (4.44%) Oracle
5 10 (4.03%) Fortinet
6 8 (3.23%) CheckPoint
7 7 (2.82%) F5
7 7 (2.82%) Meraki
8 6 (2.42%) Dell
8 6 (2.42%) Juniper
9 5 (2.02%) Google
9 5 (2.02%) Salesforce
9 5 (2.02%) Veeam
10 4 (1.61%) Apple
10 4 (1.61%) Blue Prism
10 4 (1.61%) Citrix
10 4 (1.61%) HP
10 4 (1.61%) IFS
10 4 (1.61%) UiPath