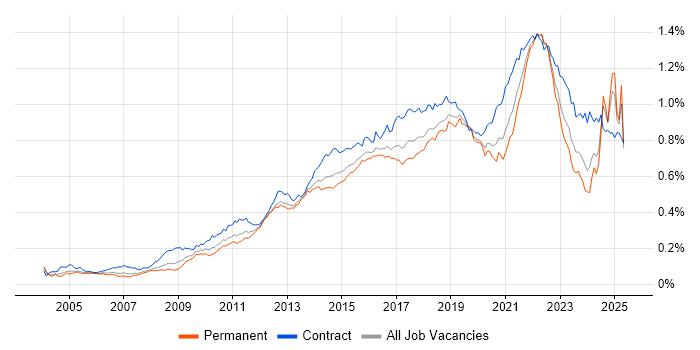
Acceptance Criteria Jobs in England

Acceptance Criteria
UK > England

The following table provides summary statistics for permanent job vacancies advertised in England with a requirement for Acceptance Criteria skills. Included is a benchmarking guide to the salaries offered in vacancies that have cited Acceptance Criteria over the 6 months to 18 May 2024 with a comparison to the same period in the previous 2 years.

6 months to
18 May 2024
Same period 2023 Same period 2022
Rank 461 384 290
Rank change year-on-year -77 -94 +134
Permanent jobs citing Acceptance Criteria 413 748 1,935
As % of all permanent jobs advertised in England 0.48% 0.85% 1.43%
As % of the Processes & Methodologies category 0.56% 0.89% 1.49%
Number of salaries quoted 267 399 1,009
10th Percentile £38,750 £40,000 £39,333
25th Percentile £46,250 £49,375 £45,000
Median annual salary (50th Percentile) £60,000 £57,500 £57,500
Median % change year-on-year +4.35% - +9.52%
75th Percentile £78,750 £68,750 £67,500
90th Percentile £87,500 £80,000 £80,450
UK median annual salary £57,500 £56,549 £57,500
% change year-on-year +1.68% -1.65% +9.52%

All Process and Methodology Skills
England

Acceptance Criteria is in the Processes and Methodologies category. The following table is for comparison with the above and provides summary statistics for all permanent job vacancies advertised in England with a requirement for process or methodology skills.

Permanent vacancies with a requirement for process or methodology skills 73,598 84,339 129,671
As % of all permanent jobs advertised in England 85.11% 95.60% 95.82%
Number of salaries quoted 53,968 50,108 73,057
10th Percentile £29,000 £34,324 £33,500
25th Percentile £40,000 £46,000 £44,000
Median annual salary (50th Percentile) £55,000 £62,500 £60,000
Median % change year-on-year -12.00% +4.17% +9.09%
75th Percentile £73,250 £82,500 £80,000
90th Percentile £93,750 £102,500 £97,500
UK median annual salary £55,000 £61,180 £60,000
% change year-on-year -10.10% +1.97% +9.09%

Acceptance Criteria
Job Vacancy Trend in England

Job postings citing Acceptance Criteria as a proportion of all IT jobs advertised in England.

Job vacancy trend for Acceptance Criteria in England

Acceptance Criteria
Salary Trend in England

3-month moving average salary quoted in jobs citing Acceptance Criteria in England.

Salary trend for Acceptance Criteria in England

Acceptance Criteria
Salary Histogram in England

Salary distribution for jobs citing Acceptance Criteria in England over the 6 months to 18 May 2024.

Salary histogram for Acceptance Criteria in England

Acceptance Criteria
Job Locations in England

The table below looks at the demand and provides a guide to the median salaries quoted in IT jobs citing Acceptance Criteria within the England region over the 6 months to 18 May 2024. The 'Rank Change' column provides an indication of the change in demand within each location based on the same 6 month period last year.

Location Rank Change
on Same Period
Last Year
Matching
Permanent
IT Job Ads
Median Salary
Past 6 Months
Median Salary
% Change
on Same Period
Last Year
Live
Jobs
London -36 158 £80,000 +33.33% 54
North of England +25 76 £47,500 -13.64% 23
South West -7 54 £55,000 - 11
North West -18 52 £47,500 -17.39% 11
Midlands -48 52 £47,500 -5.00% 14
South East -50 48 £60,000 +6.19% 31
East Midlands +14 29 £30,000 -50.00% 2
Yorkshire +82 24 £47,500 -13.64% 10
East of England -6 24 £34,500 -34.29% 17
West Midlands -52 23 £50,000 +2.56% 12
Acceptance Criteria
UK

Acceptance Criteria
Co-occurring Skills and Capabilities in England by Category

The follow tables expand on the table above by listing co-occurrences grouped by category. The same employment type, locality and period is covered with up to 20 co-occurrences shown in each of the following categories:

Application Platforms
1 50 (12.11%) Confluence
2 3 (0.73%) Apache Spark
2 3 (0.73%) SharePoint
2 3 (0.73%) Smallworld
3 1 (0.24%) Adobe Experience Manager
3 1 (0.24%) Apache Solr
3 1 (0.24%) BizTalk Server
3 1 (0.24%) CMS
3 1 (0.24%) Liferay
3 1 (0.24%) Sitecore CMS
3 1 (0.24%) Umbraco
3 1 (0.24%) WordPress
Applications
1 17 (4.12%) MS Visio
2 15 (3.63%) Trello
3 12 (2.91%) Microsoft Office
4 8 (1.94%) Microsoft Excel
5 6 (1.45%) Microsoft PowerPoint
6 5 (1.21%) Microsoft Project
7 3 (0.73%) AutoCAD
8 1 (0.24%) Adobe XD
8 1 (0.24%) Chatbot
8 1 (0.24%) InVision
8 1 (0.24%) Sketch
8 1 (0.24%) Zeplin
Business Applications
1 4 (0.97%) ResourceLink
2 3 (0.73%) SAP CRM
2 3 (0.73%) SAP PM
3 2 (0.48%) Dynamics CRM
4 1 (0.24%) Elite 3E
4 1 (0.24%) Salesforce CRM
4 1 (0.24%) Towers Watson Igloo
Cloud Services
1 71 (17.19%) Azure
2 53 (12.83%) AWS
3 33 (7.99%) Power Platform
4 22 (5.33%) SaaS
5 21 (5.08%) Miro
6 16 (3.87%) Azure DevOps
6 16 (3.87%) Serverless
7 11 (2.66%) Amazon S3
7 11 (2.66%) AWS Lambda
8 10 (2.42%) Azure Synapse Analytics
9 9 (2.18%) Azure Data Factory
9 9 (2.18%) Dynamics 365
10 8 (1.94%) Microsoft 365
11 5 (1.21%) Amazon CloudWatch
11 5 (1.21%) AWS Fargate
11 5 (1.21%) Azure Pipelines
11 5 (1.21%) BrowserStack
11 5 (1.21%) GitHub
12 4 (0.97%) GCP
12 4 (0.97%) WhatsApp
Communications & Networking
1 13 (3.15%) HTTP
2 12 (2.91%) Internet
3 10 (2.42%) Broadband
3 10 (2.42%) WPA
4 2 (0.48%) Cisco IOS
4 2 (0.48%) DSL
4 2 (0.48%) Intrusion Detection
4 2 (0.48%) SSH
4 2 (0.48%) TCP/IP
4 2 (0.48%) VPN
4 2 (0.48%) Wireless
5 1 (0.24%) AMQP
Database & Business Intelligence
1 30 (7.26%) Power BI
2 18 (4.36%) SQL Server
3 17 (4.12%) Relational Database
4 15 (3.63%) Tableau
5 12 (2.91%) Data Warehouse
5 12 (2.91%) GIS
6 11 (2.66%) NoSQL
7 10 (2.42%) Big Data
7 10 (2.42%) Geospatial Data
8 9 (2.18%) Data Lake
9 8 (1.94%) HDInsight
10 6 (1.45%) Snowflake Schema
10 6 (1.45%) Star Schema
11 5 (1.21%) DynamoDB
12 4 (0.97%) BusinessObjects
12 4 (0.97%) Hadoop
12 4 (0.97%) Looker
12 4 (0.97%) QlikView
13 3 (0.73%) Apache Hive
13 3 (0.73%) Neo4j
Development Applications
1 103 (24.94%) JIRA
2 21 (5.08%) Git
3 12 (2.91%) Postman
4 11 (2.66%) Cucumber
4 11 (2.66%) Cypress.io
4 11 (2.66%) Selenium
5 10 (2.42%) SpecFlow
6 5 (1.21%) JMeter
6 5 (1.21%) MSTest
6 5 (1.21%) Visual Studio
7 4 (0.97%) GitLab
7 4 (0.97%) Team Foundation Server
7 4 (0.97%) WebDriver
8 3 (0.73%) JUnit
9 2 (0.48%) Appium
9 2 (0.48%) Burp Suite
9 2 (0.48%) SoapUI
9 2 (0.48%) TeamCity
10 1 (0.24%) SonarQube
10 1 (0.24%) Visual Studio Coded UI
General
1 133 (32.20%) Social Skills
2 110 (26.63%) Analytical Skills
3 82 (19.85%) Finance
4 47 (11.38%) Retail
5 39 (9.44%) Marketing
6 37 (8.96%) Inclusion and Diversity
7 18 (4.36%) Pharmaceutical
8 13 (3.15%) Public Sector
9 10 (2.42%) Games
10 9 (2.18%) Legal
10 9 (2.18%) Presentation Skills
11 6 (1.45%) Advertising
11 6 (1.45%) Influencing Skills
11 6 (1.45%) Manufacturing
11 6 (1.45%) Organisational Skills
12 5 (1.21%) Automotive
12 5 (1.21%) Banking
12 5 (1.21%) Law
12 5 (1.21%) Retail Finance
13 4 (0.97%) Health Technology
Job Titles
1 117 (28.33%) Analyst
2 84 (20.34%) Business Analyst
3 72 (17.43%) Product Manager
4 67 (16.22%) Product Owner
5 57 (13.80%) Senior
6 30 (7.26%) Senior Analyst
6 30 (7.26%) Senior Business Analyst
7 19 (4.60%) Software Engineer
8 18 (4.36%) Developer
8 18 (4.36%) Research Analyst
9 17 (4.12%) Lead
10 13 (3.15%) Technical Business Analyst
10 13 (3.15%) Technical Product Owner
11 12 (2.91%) Project Manager
11 12 (2.91%) QA Engineer
11 12 (2.91%) Tester
12 11 (2.66%) Digital Product Owner
13 10 (2.42%) Data Manager
13 10 (2.42%) Senior Manager
13 10 (2.42%) Technical Analyst
Libraries, Frameworks & Software Standards
1 34 (8.23%) .NET
2 21 (5.08%) REST
3 20 (4.84%) JSON
3 20 (4.84%) Lightning Web Components
4 15 (3.63%) XML
5 14 (3.39%) CSS
6 13 (3.15%) HTML
7 10 (2.42%) React
8 9 (2.18%) Node.js
8 9 (2.18%) Web Services
9 8 (1.94%) RESTful
10 7 (1.69%) .NET Framework
11 6 (1.45%) .NET Core
11 6 (1.45%) Blazor
12 5 (1.21%) ASP.NET
12 5 (1.21%) ASP.NET MVC
12 5 (1.21%) Middleware
12 5 (1.21%) Next.js
12 5 (1.21%) Swagger
13 4 (0.97%) Gherkin
Miscellaneous
1 139 (33.66%) Product Ownership
2 25 (6.05%) NHS
3 24 (5.81%) Management Information System
4 18 (4.36%) Life Science
5 13 (3.15%) Cloud Native
6 12 (2.91%) Data Structures
7 11 (2.66%) Mobile App
7 11 (2.66%) Onboarding
8 9 (2.18%) Analytical Mindset
9 7 (1.69%) Enterprise Cloud
10 6 (1.45%) Distributed Systems
10 6 (1.45%) Enterprise Software
10 6 (1.45%) Public Cloud
11 5 (1.21%) PMI
12 4 (0.97%) Algorithms
12 4 (0.97%) Derivative
12 4 (0.97%) Greenfield Project
12 4 (0.97%) Media Streaming
12 4 (0.97%) Reinsurance
13 3 (0.73%) Linux Command Line
Operating Systems
1 9 (2.18%) Linux
2 6 (1.45%) Windows
3 5 (1.21%) Android
3 5 (1.21%) Apple iOS
4 2 (0.48%) Unix
5 1 (0.24%) AIX
5 1 (0.24%) Red Hat Enterprise Linux
Processes & Methodologies
1 268 (64.89%) Agile
2 232 (56.17%) User Stories
3 134 (32.45%) Roadmaps
4 126 (30.51%) Scrum
5 94 (22.76%) Product Roadmap
6 91 (22.03%) Problem-Solving
7 81 (19.61%) Product Backlog
8 67 (16.22%) Epics
9 66 (15.98%) Backlog Management
9 66 (15.98%) Product Vision
10 64 (15.50%) Backlog Refinement
11 59 (14.29%) Product Strategy
11 59 (14.29%) Project Management
11 59 (14.29%) User Experience
12 58 (14.04%) Requirements Gathering
13 57 (13.80%) Business Analysis
14 54 (13.08%) Product Management
15 52 (12.59%) Test Automation
16 51 (12.35%) Market Research
16 51 (12.35%) Product Requirements
Programming Languages
1 70 (16.95%) SQL
2 34 (8.23%) C#
3 27 (6.54%) JavaScript
4 25 (6.05%) Python
5 15 (3.63%) TypeScript
6 11 (2.66%) R
7 10 (2.42%) Java
8 9 (2.18%) Apex Code
9 8 (1.94%) T-SQL
10 4 (0.97%) PowerShell
11 2 (0.48%) Bash
11 2 (0.48%) Perl
11 2 (0.48%) Tcl
11 2 (0.48%) VB
12 1 (0.24%) Bicep
12 1 (0.24%) Data Analysis Expressions
Qualifications
1 94 (22.76%) Degree
2 36 (8.72%) Security Cleared
3 17 (4.12%) SC Cleared
4 13 (3.15%) CSPO
5 11 (2.66%) BPSS Clearance
6 10 (2.42%) Master's Degree
6 10 (2.42%) PMI Certification
7 6 (1.45%) IIBA
7 6 (1.45%) ISEB
7 6 (1.45%) PMP
8 5 (1.21%) AWS Certification
8 5 (1.21%) Azure Certification
8 5 (1.21%) Computer Science Degree
8 5 (1.21%) ISTQB
8 5 (1.21%) TOGAF Certification
9 4 (0.97%) MBA
10 3 (0.73%) DV Cleared
11 2 (0.48%) CAPM
11 2 (0.48%) ISTQB Foundation Certification
11 2 (0.48%) ITIL Certification
Quality Assurance & Compliance
1 73 (17.68%) QA
2 18 (4.36%) GLP
3 8 (1.94%) Accessibility
3 8 (1.94%) GDPR
4 7 (1.69%) PMO
5 6 (1.45%) IEC 62304
6 5 (1.21%) Data Quality
7 4 (0.97%) California Consumer Privacy Act
8 2 (0.48%) SLA
9 1 (0.24%) WCAG
System Software
1 4 (0.97%) Docker
2 2 (0.48%) Active Directory
2 2 (0.48%) Firmware
Systems Management
1 5 (1.21%) Grafana
1 5 (1.21%) Kibana
1 5 (1.21%) Terraform
2 3 (0.73%) Kubernetes
3 2 (0.48%) Microsoft Intune
Vendors
1 31 (7.51%) Microsoft
1 31 (7.51%) Salesforce
2 9 (2.18%) Databricks
3 8 (1.94%) Xero
4 4 (0.97%) SAP
5 3 (0.73%) Adobe
5 3 (0.73%) Cadence
6 2 (0.48%) Apple
6 2 (0.48%) Cisco
6 2 (0.48%) Oracle
6 2 (0.48%) Xamarin
7 1 (0.24%) Atlassian
7 1 (0.24%) CA Agile Central
7 1 (0.24%) Marketo
7 1 (0.24%) Red Hat
7 1 (0.24%) Sitecore
7 1 (0.24%) Sophis
7 1 (0.24%) Splunk
7 1 (0.24%) Symantec
7 1 (0.24%) VMware