Amazon S3 Jobs in England

Amazon Simple Storage Service (S3)
UK > England

The table below provides summary statistics for permanent job vacancies advertised in England requiring Amazon S3 skills. It includes a benchmarking guide to the annual salaries offered in vacancies that cited Amazon S3 over the 6 months leading up to 31 May 2025, comparing them to the same period in the previous two years.

6 months to
31 May 2025
Same period 2024 Same period 2023
Rank 348 392 416
Rank change year-on-year +44 +24 -163
Permanent jobs citing Amazon S3 376 568 630
As % of all permanent jobs advertised in England 0.76% 0.63% 0.74%
As % of the Cloud Services category 2.68% 1.84% 1.70%
Number of salaries quoted 186 374 424
10th Percentile £51,250 £47,500 £52,500
25th Percentile £60,000 £62,500 £61,813
Median annual salary (50th Percentile) £72,500 £80,000 £75,000
Median % change year-on-year -9.38% +6.67% -3.23%
75th Percentile £86,250 £92,091 £95,063
90th Percentile £95,000 £112,500 £112,500
UK median annual salary £72,500 £80,000 £75,000
% change year-on-year -9.38% +6.67% -3.23%

All Cloud Skills
England

Amazon S3 falls under the Cloud Services category. For comparison with the information above, the following table provides summary statistics for all permanent job vacancies requiring cloud computing skills in England.

Permanent vacancies with a requirement for cloud computing skills 14,050 30,881 37,045
As % of all permanent jobs advertised in England 28.49% 34.38% 43.50%
Number of salaries quoted 9,440 24,362 24,827
10th Percentile £31,250 £30,000 £34,605
25th Percentile £42,500 £41,250 £46,250
Median annual salary (50th Percentile) £60,000 £57,500 £65,000
Median % change year-on-year +4.35% -11.54% +4.00%
75th Percentile £82,500 £77,500 £85,000
90th Percentile £105,000 £97,500 £105,000
UK median annual salary £60,000 £57,500 £65,000
% change year-on-year +4.35% -11.54% +4.00%

Amazon S3
Job Vacancy Trend in England

Job postings citing Amazon S3 as a proportion of all IT jobs advertised in England.
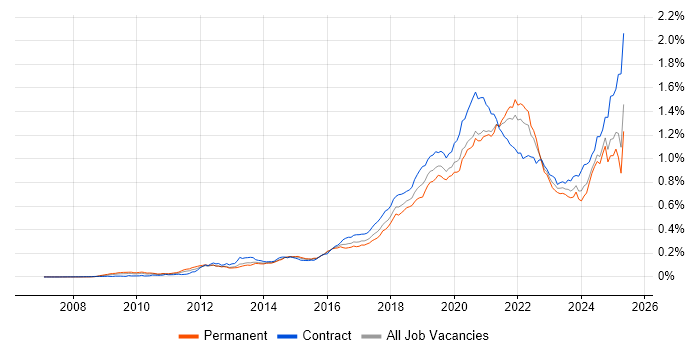
Job vacancy trend for Amazon S3 in England

Amazon S3
Salary Trend in England

3-month moving average salary quoted in jobs citing Amazon S3 in England.

Salary trend for Amazon S3 in England

Amazon S3
Salary Histogram in England

Salary distribution for jobs citing Amazon S3 in England over the 6 months to 31 May 2025.

Salary histogram for Amazon S3 in England

Amazon S3
Job Locations in England

The table below looks at the demand and provides a guide to the median salaries quoted in IT jobs citing Amazon S3 within the England region over the 6 months to 31 May 2025. The 'Rank Change' column provides an indication of the change in demand within each location based on the same 6 month period last year.

Location Rank Change
on Same Period
Last Year
Matching
Permanent
IT Job Ads
Median Salary
Past 6 Months
Median Salary
% Change
on Same Period
Last Year
Live
Jobs
London +62 181 £75,000 -13.04% 366
South East +66 50 £72,500 +7.41% 41
Midlands +35 36 £72,500 - 38
North of England -68 34 £62,500 -12.59% 74
West Midlands +47 31 £72,500 - 30
South West +103 30 £60,000 -25.00% 33
Yorkshire +52 17 £60,000 -7.69% 29
East of England +44 15 £71,500 +33.02% 18
North West -83 13 £60,000 -7.69% 33
East Midlands +22 5 £78,750 +1.61% 8
North East +32 4 £62,500 -15.54% 12
Amazon S3
UK

Amazon S3
Co-occurring Skills and Capabilities in England by Category

The follow tables expand on the table above by listing co-occurrences grouped by category. The same employment type, locality and period is covered with up to 20 co-occurrences shown in each of the following categories:

Application Platforms
1 29 (7.71%) Confluence
2 27 (7.18%) Apache Spark
3 21 (5.59%) Apache
4 20 (5.32%) Apache Airflow
5 6 (1.60%) OpenStack
6 5 (1.33%) Appian
6 5 (1.33%) SAS
7 4 (1.06%) nginx
8 3 (0.80%) CMS
8 3 (0.80%) Microsoft Exchange
8 3 (0.80%) SharePoint
8 3 (0.80%) WordPress
9 2 (0.53%) Headless CMS
Applications
1 10 (2.66%) Mozilla Thunderbird
2 5 (1.33%) Microsoft Office
3 1 (0.27%) Adobe XD
3 1 (0.27%) Microsoft Excel
3 1 (0.27%) Microsoft PowerPoint
3 1 (0.27%) MS Visio
Business Applications
1 6 (1.60%) SimCorp Dimension
2 1 (0.27%) Payment Gateway
Cloud Services
1 366 (97.34%) AWS
2 243 (64.63%) Serverless
3 236 (62.77%) AWS Lambda
4 177 (47.07%) Amazon EC2
5 90 (23.94%) AWS Step Functions
6 63 (16.76%) Amazon CloudWatch
7 62 (16.49%) Virtual Private Cloud
8 46 (12.23%) Amazon EKS
9 42 (11.17%) Azure
10 41 (10.90%) Amazon ECS
11 40 (10.64%) AWS KMS
12 36 (9.57%) AWS CloudFormation
13 35 (9.31%) Amazon SQS
14 29 (7.71%) Datadog
15 27 (7.18%) Snowflake
16 25 (6.65%) GitHub
17 24 (6.38%) Amazon Kinesis
18 23 (6.12%) Route 53
19 21 (5.59%) Amazon ELB
20 20 (5.32%) GCP
Communications & Networking
1 72 (19.15%) Broadband
2 27 (7.18%) Firewall
3 14 (3.72%) DNS
4 11 (2.93%) SSL
4 11 (2.93%) VPN
5 8 (2.13%) FTP
5 8 (2.13%) HTTP
5 8 (2.13%) SMTP
5 8 (2.13%) SSH
6 6 (1.60%) Internet
7 5 (1.33%) MQTT
7 5 (1.33%) SMS
8 4 (1.06%) LAN
8 4 (1.06%) Wi-Fi
9 3 (0.80%) Bluetooth
9 3 (0.80%) IMAP
9 3 (0.80%) OpenLDAP
10 1 (0.27%) Cisco IOS
10 1 (0.27%) Value-Added Service
Database & Business Intelligence
1 137 (36.44%) DynamoDB
2 122 (32.45%) Amazon RDS
3 76 (20.21%) Elasticsearch
4 62 (16.49%) PostgreSQL
5 59 (15.69%) Amazon Redshift
6 44 (11.70%) NoSQL
7 41 (10.90%) Data Warehouse
8 40 (10.64%) Data Lake
9 29 (7.71%) Amazon Athena
10 22 (5.85%) Amazon Aurora
11 21 (5.59%) MySQL
12 15 (3.99%) Big Data
13 12 (3.19%) MongoDB
13 12 (3.19%) Relational Database
13 12 (3.19%) Tableau
14 11 (2.93%) BigQuery
15 10 (2.66%) Power BI
16 9 (2.39%) Hadoop
16 9 (2.39%) Parquet
17 8 (2.13%) Apache Hive
Development Applications
1 94 (25.00%) Jenkins
2 93 (24.73%) Git
3 42 (11.17%) GitLab
4 36 (9.57%) JIRA
5 30 (7.98%) JUnit
6 27 (7.18%) Maven
7 25 (6.65%) Mockito
8 20 (5.32%) Vagrant
9 17 (4.52%) Bitbucket Server
9 17 (4.52%) Cucumber
10 14 (3.72%) IntelliJ
11 13 (3.46%) CircleCI
11 13 (3.46%) SonarQube
12 10 (2.66%) DbUnit
12 10 (2.66%) jMock
12 10 (2.66%) Selenium
13 6 (1.60%) Sonatype Nexus
14 5 (1.33%) Robot Framework
14 5 (1.33%) Snyk
15 4 (1.06%) Bitbucket
General
1 109 (28.99%) Social Skills
2 84 (22.34%) Finance
3 32 (8.51%) Banking
4 31 (8.24%) Public Sector
5 30 (7.98%) Analytical Skills
6 18 (4.79%) Inclusion and Diversity
7 17 (4.52%) Marketing
7 17 (4.52%) Presentation Skills
8 16 (4.26%) Law
9 8 (2.13%) Advertising
9 8 (2.13%) Manufacturing
10 7 (1.86%) Financial Institution
10 7 (1.86%) Retail
11 6 (1.60%) Investment Banking
12 5 (1.33%) Games
12 5 (1.33%) Legal
12 5 (1.33%) Organisational Skills
12 5 (1.33%) Retail Banking
12 5 (1.33%) Tech for Good
13 4 (1.06%) Publishing
Job Titles
1 160 (42.55%) Developer
2 153 (40.69%) Senior
3 106 (28.19%) AWS Developer
3 106 (28.19%) Senior Developer
4 53 (14.10%) Data Engineer
5 42 (11.17%) AWS Engineer
6 37 (9.84%) Java Developer
7 29 (7.71%) Software Engineer
8 28 (7.45%) Architect
9 26 (6.91%) Lead
10 22 (5.85%) Senior Data Engineer
11 21 (5.59%) AWS DevOps
11 21 (5.59%) DevOps Engineer
12 19 (5.05%) Platform Engineer
12 19 (5.05%) Senior Java Developer
13 18 (4.79%) Python Developer
14 16 (4.26%) Full-Stack Developer
15 15 (3.99%) Senior DevOps
16 14 (3.72%) DevOps Developer
16 14 (3.72%) Java Pricing Developer
Libraries, Frameworks & Software Standards
1 124 (32.98%) React
2 90 (23.94%) GraphQL
3 72 (19.15%) Serverless Framework
4 50 (13.30%) RESTful
5 47 (12.50%) Spring
6 45 (11.97%) Kafka
6 45 (11.97%) Spring Boot
7 31 (8.24%) REST
8 26 (6.91%) ActiveMQ
9 25 (6.65%) Node.js
10 20 (5.32%) Web Services
11 19 (5.05%) AngularJS
12 16 (4.26%) PySpark
13 15 (3.99%) RabbitMQ
14 14 (3.72%) Bootstrap
14 14 (3.72%) JMS
15 13 (3.46%) gRPC
16 12 (3.19%) CSS
16 12 (3.19%) HTML
16 12 (3.19%) SOAP
Miscellaneous
1 54 (14.36%) Cloud Native
2 17 (4.52%) Management Information System
3 16 (4.26%) Replication
4 14 (3.72%) Credit Derivative
4 14 (3.72%) Enterprise Software
5 13 (3.46%) Product Ownership
6 12 (3.19%) Distributed Systems
7 10 (2.66%) Algorithms
7 10 (2.66%) Distributed Applications
8 8 (2.13%) Blockchain
8 8 (2.13%) Data Structures
8 8 (2.13%) IoT
8 8 (2.13%) Mobile App
8 8 (2.13%) Web3
9 7 (1.86%) Public Cloud
10 6 (1.60%) Distributed Architecture
10 6 (1.60%) Greenfield Project
11 5 (1.33%) Legacy Systems
11 5 (1.33%) Low-Code
11 5 (1.33%) Onboarding
Operating Systems
1 75 (19.95%) Linux
2 27 (7.18%) Windows
3 20 (5.32%) VMS
4 13 (3.46%) Ubuntu
5 9 (2.39%) Amazon Linux
6 4 (1.06%) Mac OS
7 1 (0.27%) Android
7 1 (0.27%) Apple iOS
7 1 (0.27%) Debian
7 1 (0.27%) Unix
7 1 (0.27%) Windows 10
Processes & Methodologies
1 209 (55.59%) CI/CD
2 201 (53.46%) Agile
3 121 (32.18%) Mentoring
4 111 (29.52%) DevOps
5 107 (28.46%) Continuous Integration
6 98 (26.06%) Artificial Intelligence
7 92 (24.47%) Event-Driven
8 81 (21.54%) Event-Driven Architecture
9 80 (21.28%) Software Engineering
10 77 (20.48%) Clean Code
10 77 (20.48%) Infrastructure as Code
11 74 (19.68%) Containerisation
12 67 (17.82%) Analytics
12 67 (17.82%) Microservices
13 58 (15.43%) ETL
14 56 (14.89%) Problem-Solving
15 52 (13.83%) Data Pipeline
16 44 (11.70%) Scrum
16 44 (11.70%) Test Automation
17 40 (10.64%) Machine Learning
Programming Languages
1 239 (63.56%) Python
2 120 (31.91%) JavaScript
3 109 (28.99%) TypeScript
4 95 (25.27%) SQL
5 93 (24.73%) Java
6 24 (6.38%) PowerShell
7 22 (5.85%) Groovy
8 17 (4.52%) C++
9 15 (3.99%) Bash
9 15 (3.99%) Scala
10 14 (3.72%) Go
11 12 (3.19%) C#
12 10 (2.66%) Perl
12 10 (2.66%) PHP
13 9 (2.39%) Shell Script
14 6 (1.60%) R
14 6 (1.60%) Ruby
15 5 (1.33%) MATLAB
16 4 (1.06%) PL/SQL
17 3 (0.80%) C
Qualifications
1 96 (25.53%) AWS Certification
2 57 (15.16%) Security Cleared
3 41 (10.90%) SC Cleared
4 33 (8.78%) Degree
5 18 (4.79%) Computer Science Degree
6 14 (3.72%) DV Cleared
7 7 (1.86%) Master's Degree
8 6 (1.60%) AWS Certified Solutions Architect
9 5 (1.33%) Azure Certification
10 4 (1.06%) AWS Certified Developer
11 3 (0.80%) DBS Check
12 2 (0.53%) (ISC)2 CCSP
12 2 (0.53%) AWS Certified DevOps Engineer
12 2 (0.53%) AWS Certified SysOps Administrator
12 2 (0.53%) Cisco Certification
12 2 (0.53%) ISTQB
13 1 (0.27%) CBAP
13 1 (0.27%) PhD
13 1 (0.27%) PMI Certification
13 1 (0.27%) PMP
Quality Assurance & Compliance
1 29 (7.71%) QA
2 23 (6.12%) Data Quality
3 5 (1.33%) Accessibility
3 5 (1.33%) GDPR
3 5 (1.33%) ISO/IEC 27001
4 4 (1.06%) GMP
4 4 (1.06%) NIST
5 2 (0.53%) HIPAA
5 2 (0.53%) PCI DSS
5 2 (0.53%) SEPA
5 2 (0.53%) SLA
6 1 (0.27%) Sarbanes-Oxley
6 1 (0.27%) SOC 2
System Software
1 105 (27.93%) Docker
2 24 (6.38%) Active Directory
3 13 (3.46%) DFS Replication
4 11 (2.93%) Virtual Desktop
5 10 (2.66%) Virtual Machines
6 6 (1.60%) Postfix
7 5 (1.33%) Apache Flume
8 4 (1.06%) VMware Infrastructure
9 3 (0.80%) Dovecot
9 3 (0.80%) HDFS
9 3 (0.80%) Squid
Systems Management
1 104 (27.66%) Terraform
2 73 (19.41%) Kubernetes
3 49 (13.03%) Ansible
4 38 (10.11%) Prometheus
5 34 (9.04%) Grafana
6 10 (2.66%) Nessus
6 10 (2.66%) Proxmox
7 7 (1.86%) Single Sign-On
8 5 (1.33%) Oozie
8 5 (1.33%) Progress Chef
9 4 (1.06%) Puppet
10 3 (0.80%) Kibana
10 3 (0.80%) Nagios
11 2 (0.53%) Hadoop YARN
11 2 (0.53%) logstash
12 1 (0.27%) Argo
12 1 (0.27%) Bugsnag
12 1 (0.27%) Istio
12 1 (0.27%) Kustomize
12 1 (0.27%) Packer
Vendors
1 22 (5.85%) Oracle
2 20 (5.32%) Databricks
3 18 (4.79%) ServiceNow
4 15 (3.99%) IBM
4 15 (3.99%) Juniper
4 15 (3.99%) Microsoft
5 14 (3.72%) Atlassian
6 13 (3.46%) Google
7 11 (2.93%) Cisco
8 8 (2.13%) Cloudera
9 7 (1.86%) Jaspersoft
10 6 (1.60%) SimCorp
10 6 (1.60%) Splunk
11 5 (1.33%) BiZZdesign
11 5 (1.33%) Black Duck
11 5 (1.33%) Intel
11 5 (1.33%) SAP
11 5 (1.33%) UiPath
11 5 (1.33%) VMware
12 4 (1.06%) StreamSets