User Acceptance Testing Jobs in London

User Acceptance Testing (UAT)
England > London

The table below provides summary statistics for permanent job vacancies advertised in London requiring User Acceptance Testing skills. It includes a benchmarking guide to the annual salaries offered in vacancies that cited User Acceptance Testing over the 6 months leading up to 17 May 2025, comparing them to the same period in the previous two years.

6 months to
17 May 2025
Same period 2024 Same period 2023
Rank 275 308 255
Rank change year-on-year +33 -53 +104
Permanent jobs citing User Acceptance Testing 115 202 471
As % of all permanent jobs advertised in London 0.89% 0.85% 1.40%
As % of the Processes & Methodologies category 0.92% 0.94% 1.47%
Number of salaries quoted 75 156 358
10th Percentile £48,750 £39,750 £42,500
25th Percentile £60,000 £47,875 £46,250
Median annual salary (50th Percentile) £72,500 £61,500 £60,000
Median % change year-on-year +17.89% +2.50% -7.69%
75th Percentile £81,250 £80,000 £73,287
90th Percentile £112,500 £90,625 £94,475
England median annual salary £57,560 £56,000 £55,000
% change year-on-year +2.78% +1.82% -

All Process and Methodology Skills
London

User Acceptance Testing falls under the Processes and Methodologies category. For comparison with the information above, the following table provides summary statistics for all permanent job vacancies requiring process or methodology skills in London.

Permanent vacancies with a requirement for process or methodology skills 12,437 21,541 32,138
As % of all permanent jobs advertised in London 96.16% 91.06% 95.35%
Number of salaries quoted 7,272 15,921 23,160
10th Percentile £42,000 £37,500 £43,241
25th Percentile £56,000 £51,500 £55,000
Median annual salary (50th Percentile) £75,000 £70,073 £75,000
Median % change year-on-year +7.03% -6.57% +7.14%
75th Percentile £100,000 £95,000 £95,000
90th Percentile £122,500 £115,000 £115,000
England median annual salary £57,500 £55,000 £62,500
% change year-on-year +4.55% -12.00% +4.17%

User Acceptance Testing
Job Vacancy Trend in London

Job postings citing User Acceptance Testing as a proportion of all IT jobs advertised in London.
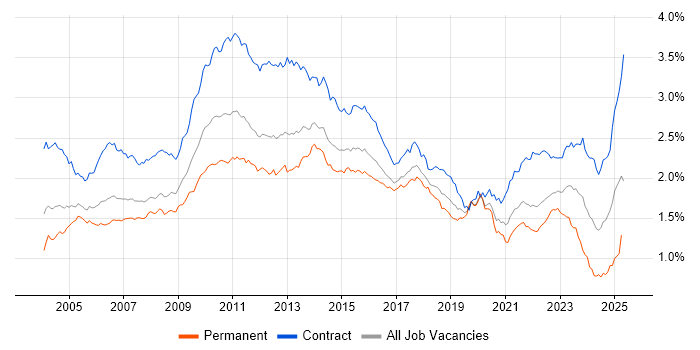
Job vacancy trend for User Acceptance Testing in London

User Acceptance Testing
Salary Trend in London

3-month moving average salary quoted in jobs citing User Acceptance Testing in London.

Salary trend for User Acceptance Testing in London

User Acceptance Testing
Salary Histogram in London

Salary distribution for jobs citing User Acceptance Testing in London over the 6 months to 17 May 2025.

Salary histogram for User Acceptance Testing in London

User Acceptance Testing
Job Locations in London

The table below looks at the demand and provides a guide to the median salaries quoted in IT jobs citing User Acceptance Testing within the London region over the 6 months to 17 May 2025. The 'Rank Change' column provides an indication of the change in demand within each location based on the same 6 month period last year.

Location Rank Change
on Same Period
Last Year
Matching
Permanent
IT Job Ads
Median Salary
Past 6 Months
Median Salary
% Change
on Same Period
Last Year
Live
Jobs
Central London +50 29 £73,750 +9.26% 23
South London -3 3 £43,328 -8.78% 9
East London -8 3 £49,500 -
North London - 1 £60,000 - 1
User Acceptance Testing
England

User Acceptance Testing
Co-occurring Skills and Capabilities in London by Category

The follow tables expand on the table above by listing co-occurrences grouped by category. The same employment type, locality and period is covered with up to 20 co-occurrences shown in each of the following categories:

Application Platforms
1 8 (6.96%) SharePoint
2 4 (3.48%) Confluence
3 2 (1.74%) Apache Airflow
4 1 (0.87%) Apache
4 1 (0.87%) Microsoft Exchange
Applications
1 15 (13.04%) Microsoft Excel
2 7 (6.09%) Microsoft Office
2 7 (6.09%) Microsoft Project
3 3 (2.61%) Microsoft PowerPoint
4 2 (1.74%) MS Visio
5 1 (0.87%) Sketch
Business Applications
1 7 (6.09%) Aladdin
1 7 (6.09%) Dynamics CRM
2 5 (4.35%) Dynamics AX
3 2 (1.74%) NEC Housing
4 1 (0.87%) Dynamics NAV
4 1 (0.87%) Endur
4 1 (0.87%) SAP S/4HANA
Cloud Services
1 30 (26.09%) Azure
2 19 (16.52%) Azure DevOps
3 18 (15.65%) Dynamics 365
4 11 (9.57%) Power Platform
5 6 (5.22%) SaaS
6 5 (4.35%) Microsoft 365
7 4 (3.48%) AWS
7 4 (3.48%) Power Automate
7 4 (3.48%) PowerApps
8 2 (1.74%) Adobe Analytics
8 2 (1.74%) Azure Data Factory
8 2 (1.74%) Azure Logic Apps
8 2 (1.74%) dbt
8 2 (1.74%) PaaS
8 2 (1.74%) Salesforce Sales Cloud
8 2 (1.74%) Salesforce Service Cloud
8 2 (1.74%) Serverless
8 2 (1.74%) Snowflake
9 1 (0.87%) BlazeMeter
9 1 (0.87%) Figma
Communications & Networking
1 1 (0.87%) Firewall
1 1 (0.87%) SAN
1 1 (0.87%) SSH
1 1 (0.87%) VoIP
Database & Business Intelligence
1 12 (10.43%) SQL Server
2 9 (7.83%) Power BI
3 5 (4.35%) Data Warehouse
4 4 (3.48%) Oracle Database
4 4 (3.48%) Oracle Reports
4 4 (3.48%) PostgreSQL
4 4 (3.48%) Tableau
5 3 (2.61%) Relational Database
6 2 (1.74%) Data Lake
6 2 (1.74%) NoSQL
6 2 (1.74%) Parquet
6 2 (1.74%) SQL Server Reporting Services
6 2 (1.74%) Tableau Desktop
7 1 (0.87%) Amazon Athena
7 1 (0.87%) DynamoDB
7 1 (0.87%) Electronic Patient Records
7 1 (0.87%) Geospatial Data
7 1 (0.87%) GIS
7 1 (0.87%) SAP Data Services
7 1 (0.87%) Spatial Data
Development Applications
1 12 (10.43%) JIRA
2 5 (4.35%) Selenium
3 4 (3.48%) JMeter
3 4 (3.48%) JUnit
4 3 (2.61%) Cypress.io
4 3 (2.61%) LoadRunner
4 3 (2.61%) Postman
4 3 (2.61%) TestRail
5 2 (1.74%) Cucumber
5 2 (1.74%) Git
5 2 (1.74%) Jenkins
5 2 (1.74%) TeamCity
6 1 (0.87%) Atlassian Bamboo
6 1 (0.87%) Bitbucket
6 1 (0.87%) Eclipse
6 1 (0.87%) Gatling
6 1 (0.87%) Locust
6 1 (0.87%) REST Assured
6 1 (0.87%) Team Foundation Server
6 1 (0.87%) Visual Studio Code
General
1 56 (48.70%) Finance
2 34 (29.57%) Social Skills
3 19 (16.52%) Analytical Skills
4 12 (10.43%) Banking
5 11 (9.57%) Presentation Skills
6 10 (8.70%) Front Office
7 8 (6.96%) Inclusion and Diversity
7 8 (6.96%) Law
8 7 (6.09%) Back Office
8 7 (6.09%) Marketing
9 6 (5.22%) Organisational Skills
10 5 (4.35%) Legal
10 5 (4.35%) Public Sector
10 5 (4.35%) Retail
11 4 (3.48%) Local Government
12 3 (2.61%) German Language
12 3 (2.61%) Influencing Skills
12 3 (2.61%) Private Banking
12 3 (2.61%) Retail Banking
13 2 (1.74%) Documentation Skills
Job Titles
1 43 (37.39%) Analyst
2 29 (25.22%) Business Analyst
3 15 (13.04%) Consultant
4 14 (12.17%) Senior
5 11 (9.57%) Project Manager
5 11 (9.57%) Test Manager
6 9 (7.83%) Functional Consultant
7 8 (6.96%) Finance Manager
7 8 (6.96%) Senior Analyst
8 7 (6.09%) Business Manager
8 7 (6.09%) Dynamics 365 Consultant
8 7 (6.09%) Finance Business Analyst
8 7 (6.09%) Financial Analyst
8 7 (6.09%) Fixed Income Business Analyst
8 7 (6.09%) Insurance Business Analyst
9 5 (4.35%) Architect
9 5 (4.35%) Lead
10 4 (3.48%) Senior Manager
10 4 (3.48%) Support Analyst
10 4 (3.48%) Tester
Libraries, Frameworks & Software Standards
1 9 (7.83%) .NET
2 7 (6.09%) RESTful
3 5 (4.35%) Web Services
4 4 (3.48%) Oracle Fusion
5 3 (2.61%) HTML
5 3 (2.61%) JSON
5 3 (2.61%) Middleware
5 3 (2.61%) XML
6 2 (1.74%) AngularJS
6 2 (1.74%) ASP.NET
6 2 (1.74%) ASP.NET Web API
6 2 (1.74%) CSS
6 2 (1.74%) Elastic Stack
6 2 (1.74%) Node.js
6 2 (1.74%) PostGIS
6 2 (1.74%) Razor View Engine
6 2 (1.74%) React
6 2 (1.74%) REST
6 2 (1.74%) Spring
6 2 (1.74%) Spring Boot
Miscellaneous
1 13 (11.30%) Management Information System
2 12 (10.43%) Derivative
3 7 (6.09%) Fixed Income
3 7 (6.09%) Hedge funds
4 6 (5.22%) Product Ownership
5 4 (3.48%) Analytical Mindset
5 4 (3.48%) Foreign Exchange (FX)
5 4 (3.48%) Reinsurance
6 3 (2.61%) Equities
6 3 (2.61%) Self-Motivation
6 3 (2.61%) Video Conferencing
7 2 (1.74%) Onboarding
7 2 (1.74%) PMI
7 2 (1.74%) Virtual Team
8 1 (0.87%) Distributed Architecture
8 1 (0.87%) Greenfield Project
8 1 (0.87%) Learning Management System
8 1 (0.87%) NHS
8 1 (0.87%) Online Games
8 1 (0.87%) Renewable Energy
Operating Systems
1 9 (7.83%) Windows
2 5 (4.35%) Linux
3 3 (2.61%) Unix
4 2 (1.74%) Windows Vista
5 1 (0.87%) Mac OS
5 1 (0.87%) Windows Server
Processes & Methodologies
1 57 (49.57%) Agile
2 33 (28.70%) DevOps
3 29 (25.22%) Business Analysis
3 29 (25.22%) Problem-Solving
4 20 (17.39%) Requirements Gathering
5 18 (15.65%) Scrum
5 18 (15.65%) Stakeholder Management
6 17 (14.78%) Test Automation
7 16 (13.91%) Business Intelligence
7 16 (13.91%) Migration
8 15 (13.04%) User Stories
9 14 (12.17%) Continuous Improvement
10 13 (11.30%) Project Management
10 13 (11.30%) Regression Testing
10 13 (11.30%) System Integration Testing
11 12 (10.43%) ERP
11 12 (10.43%) Mentoring
12 11 (9.57%) Change Management
12 11 (9.57%) Data Migration
12 11 (9.57%) Test Scripting
Programming Languages
1 39 (33.91%) SQL
2 13 (11.30%) Python
3 7 (6.09%) JavaScript
4 5 (4.35%) C#
4 5 (4.35%) Java
5 3 (2.61%) Data Analysis Expressions
5 3 (2.61%) T-SQL
6 1 (0.87%) Apex Code
6 1 (0.87%) Bash
6 1 (0.87%) PowerShell
6 1 (0.87%) TypeScript
Qualifications
1 25 (21.74%) Degree
2 7 (6.09%) Microsoft Certification
3 6 (5.22%) Security Cleared
4 5 (4.35%) ISTQB
4 5 (4.35%) ISTQB Foundation Certification
4 5 (4.35%) MCP
4 5 (4.35%) PMI Certification
5 4 (3.48%) Azure Certification
6 3 (2.61%) CISSP
6 3 (2.61%) PMP
6 3 (2.61%) SC Cleared
7 2 (1.74%) BPSS Clearance
7 2 (1.74%) CBAP
7 2 (1.74%) Computer Science Degree
7 2 (1.74%) Master's Degree
7 2 (1.74%) MBA
8 1 (0.87%) AWS Certified Developer
8 1 (0.87%) IIBA
8 1 (0.87%) ISTQB Advanced Certification
8 1 (0.87%) ITIL Foundation Certificate
Quality Assurance & Compliance
1 25 (21.74%) QA
2 5 (4.35%) PMO
3 4 (3.48%) MiFID
4 3 (2.61%) EMIR
5 2 (1.74%) Accessibility
5 2 (1.74%) Data Quality
6 1 (0.87%) GDPR
6 1 (0.87%) ISO 20022
6 1 (0.87%) PCI DSS
6 1 (0.87%) PSD2
6 1 (0.87%) SEPA
System Software
1 1 (0.87%) Docker
Systems Management
1 3 (2.61%) HP Quality Center
2 1 (0.87%) Kubernetes
2 1 (0.87%) Prometheus
2 1 (0.87%) Terraform
Vendors
1 21 (18.26%) Microsoft
2 12 (10.43%) Oracle
3 7 (6.09%) BISAM
4 6 (5.22%) SAP
5 3 (2.61%) Intel
5 3 (2.61%) Salesforce
6 2 (1.74%) Adobe
6 2 (1.74%) Alteryx
6 2 (1.74%) Charles River
6 2 (1.74%) Google
6 2 (1.74%) NEC
6 2 (1.74%) Pega
6 2 (1.74%) Splunk
6 2 (1.74%) Sun
7 1 (0.87%) Guidewire
7 1 (0.87%) iManage
7 1 (0.87%) MuleSoft
7 1 (0.87%) ServiceNow
7 1 (0.87%) Sitecore
7 1 (0.87%) WatchGuard