Hybrid/Remote Web Conferencing Job Trends

Web Conferencing (Webinars)
UK > Work from Home

The table below looks at the prevalence of the term Web Conferencing in remote or hybrid work. Included is a benchmarking guide to the salaries offered in vacancies that cited Web Conferencing over the 6 months leading up to 25 September 2025, comparing them to the same period in the previous two years.

6 months to
25 Sep 2025
Same period 2024 Same period 2023
Rank 378 447 400
Rank change year-on-year +69 -47 +242
Permanent jobs citing Web Conferencing 42 45 114
As % of all permanent jobs with a WFH option 0.25% 0.20% 0.47%
As % of the Miscellaneous category 0.61% 0.58% 1.13%
Number of salaries quoted 22 23 95
10th Percentile £31,250 £32,100 £43,500
25th Percentile £31,438 £32,500 £46,570
Median annual salary (50th Percentile) £46,250 £37,500 £48,687
Median % change year-on-year +23.33% -22.98% -24.81%
75th Percentile £66,250 £48,797 £50,803
90th Percentile £90,125 £70,692 £77,500
UK median annual salary £40,000 £37,500 £48,687
% change year-on-year +6.67% -22.98% +21.72%

All Generic Skills
Work from Home

Web Conferencing falls under the General and Transferable Skills category. For comparison with the information above, the following table provides summary statistics for all permanent job vacancies with remote or hybrid options requiring generic IT skills.

Permanent vacancies with a requirement for generic IT skills 6,898 7,779 10,051
As % of all permanent jobs with a WFH option 41.85% 33.77% 41.74%
Number of salaries quoted 3,509 4,645 8,115
10th Percentile £30,000 £35,000 £39,294
25th Percentile £40,750 £46,250 £49,393
Median annual salary (50th Percentile) £60,000 £62,500 £65,000
Median % change year-on-year -4.00% -3.85% -
75th Percentile £85,000 £90,000 £85,000
90th Percentile £115,000 £122,500 £105,750
UK median annual salary £55,000 £60,000 £62,500
% change year-on-year -8.33% -4.00% -

Web Conferencing
Trend for Jobs with a WFH Option

Job vacancies with remote working options citing Web Conferencing as a proportion of all IT jobs advertised.
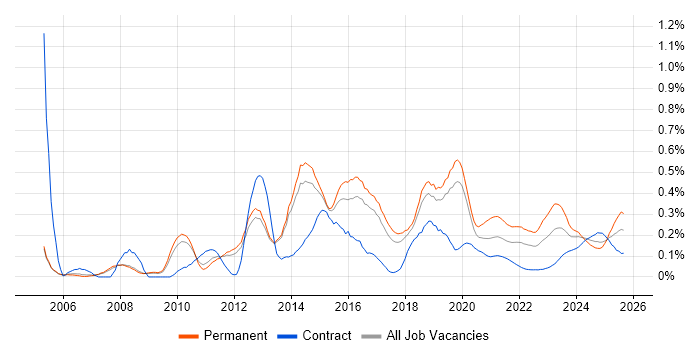
Web Conferencing trend for jobs with Hybrid/Remote/WFH options

Web Conferencing
Salary Trend for Jobs with Hybrid Work Options

Salary distribution trend for jobs with remote work options citing Web Conferencing.

Salary distribution trend for jobs with remote work options citing Web Conferencing

Web Conferencing
Salary Histogram for Jobs with a WFH Option

Salary distribution for jobs with remote working options citing Web Conferencing over the 6 months to 25 September 2025.

Web Conferencing salary histogram for jobs with a WFH option

Web Conferencing
Co-occurring Skills and Capabilities with WFH Options by Category

The follow tables expand on the table above by listing co-occurrences grouped by category. The same employment type, locality and period is covered with up to 20 co-occurrences shown in each of the following categories:

Application Platforms
1 6 (14.29%) WordPress
2 2 (4.76%) CMS
2 2 (4.76%) Umbraco
3 1 (2.38%) Drupal
3 1 (2.38%) SharePoint
Applications
1 4 (9.52%) Microsoft PowerPoint
2 3 (7.14%) InDesign
2 3 (7.14%) Microsoft Excel
3 2 (4.76%) Adobe Creative Suite
4 1 (2.38%) Microsoft Office
Business Applications
1 2 (4.76%) Dynamics CRM
Cloud Services
1 9 (21.43%) SaaS
2 6 (14.29%) Google Analytics
3 5 (11.90%) Google Ads
4 3 (7.14%) Canva
5 2 (4.76%) MailChimp
6 1 (2.38%) AWS
6 1 (2.38%) AWS Lambda
6 1 (2.38%) Firebase
6 1 (2.38%) Microsoft 365
6 1 (2.38%) Serverless
Communications & Networking
1 2 (4.76%) Intranet
Database & Business Intelligence
1 1 (2.38%) DynamoDB
General
1 20 (47.62%) Marketing
2 16 (38.10%) Social Skills
3 7 (16.67%) Finance
3 7 (16.67%) Inclusion and Diversity
4 6 (14.29%) Analytical Skills
5 5 (11.90%) Organisational Skills
6 4 (9.52%) Advertising
7 3 (7.14%) Brand Awareness
8 2 (4.76%) Financial Institution
8 2 (4.76%) French Language
8 2 (4.76%) Legal
8 2 (4.76%) Mandarin Language
8 2 (4.76%) Portuguese Language
8 2 (4.76%) Spanish Language
9 1 (2.38%) Manufacturing
9 1 (2.38%) Publishing
Job Titles
1 6 (14.29%) Consultant
1 6 (14.29%) Presales Consultant
2 5 (11.90%) IT Consultant
3 4 (9.52%) Communications Officer
3 4 (9.52%) Digital Marketing Specialist
3 4 (9.52%) Marketing Specialist
3 4 (9.52%) Sales Executive
3 4 (9.52%) Technical Sales Executive
4 3 (7.14%) Content Designer
4 3 (7.14%) Designer
4 3 (7.14%) e-Learning Designer
5 2 (4.76%) Business Development Manager
5 2 (4.76%) Business Manager
5 2 (4.76%) Developer
5 2 (4.76%) Development Manager
5 2 (4.76%) Digital Marketer
5 2 (4.76%) Marketing Executive
6 1 (2.38%) Programme Manager
6 1 (2.38%) Project Manager
6 1 (2.38%) Web Developer
Libraries, Frameworks & Software Standards
1 1 (2.38%) CSS
1 1 (2.38%) GraphQL
1 1 (2.38%) HTML
1 1 (2.38%) Node.js
1 1 (2.38%) React
Miscellaneous
1 19 (45.24%) Social Media
2 9 (21.43%) Blog
2 9 (21.43%) Graphic Design
3 7 (16.67%) e-Learning
3 7 (16.67%) Onboarding
3 7 (16.67%) Video Editing
4 6 (14.29%) Learning Management System
5 4 (9.52%) Driving Licence
5 4 (9.52%) Product Ownership
6 3 (7.14%) Analytical Mindset
6 3 (7.14%) Animation
6 3 (7.14%) Self-Motivation
7 2 (4.76%) Data Centre
7 2 (4.76%) Hybrid Cloud
7 2 (4.76%) Management Information System
7 2 (4.76%) Podcast
8 1 (2.38%) IoT
8 1 (2.38%) Photography
8 1 (2.38%) Robotics
Operating Systems
1 1 (2.38%) Android
Processes & Methodologies
1 13 (30.95%) Decision-Making
2 12 (28.57%) SEO
3 11 (26.19%) Artificial Intelligence
4 10 (23.81%) Analytics
5 9 (21.43%) Digital Marketing
6 8 (19.05%) Presales
7 6 (14.29%) B2B
7 6 (14.29%) CRM
7 6 (14.29%) Cybersecurity
7 6 (14.29%) Pay per click
7 6 (14.29%) Problem-Solving
8 5 (11.90%) Email Marketing
8 5 (11.90%) User Experience
9 4 (9.52%) Instructional Design
9 4 (9.52%) Marketing Strategy
9 4 (9.52%) Product Management
9 4 (9.52%) Roadmaps
10 3 (7.14%) Channel Management
10 3 (7.14%) Data-Driven Decision Making
10 3 (7.14%) Product Roadmap
Programming Languages
1 1 (2.38%) JavaScript
1 1 (2.38%) TypeScript
Qualifications
1 5 (11.90%) Degree
2 1 (2.38%) BPSS Clearance
2 1 (2.38%) Master's Degree
2 1 (2.38%) NVQ Level 4
2 1 (2.38%) Security Cleared
Quality Assurance & Compliance
1 3 (7.14%) Accessibility
Vendors
1 10 (23.81%) Google
2 8 (19.05%) Microsoft
3 7 (16.67%) Adobe
4 4 (9.52%) Hootsuite
4 4 (9.52%) Instagram
4 4 (9.52%) Salesforce
4 4 (9.52%) YouTube
5 2 (4.76%) Apple
5 2 (4.76%) Dell
5 2 (4.76%) Facebook
6 1 (2.38%) HP
6 1 (2.38%) HubSpot