Hybrid/Remote Presales Job Trends

Presales
UK > Work from Home

The table below provides summary statistics and salary benchmarking for remote or hybrid work requiring Presales skills. It covers permanent job vacancies from the 6 months leading up to 20 October 2025, with comparisons to the same periods in the previous two years.

6 months to
20 Oct 2025
Same period 2024 Same period 2023
Rank 215 145 192
Rank change year-on-year -70 +47 +19
Permanent jobs citing Presales 221 462 392
As % of all permanent jobs with remote/hybrid work options 1.36% 2.29% 1.69%
As % of the Processes & Methodologies category 1.46% 2.60% 1.77%
Number of salaries quoted 175 218 274
10th Percentile £41,750 £36,750 £46,250
25th Percentile £56,250 £53,750 £53,750
Median annual salary (50th Percentile) £75,000 £76,250 £80,000
Median % change year-on-year -1.64% -4.69% +6.67%
75th Percentile £98,750 £86,250 £90,000
90th Percentile £115,000 £96,250 £97,500
UK median annual salary £70,000 £75,000 £72,500
% change year-on-year -6.67% +3.45% -3.33%

All Process and Methodology Skills
Work from Home

Presales falls under the Processes and Methodologies category. For comparison with the information above, the following table provides summary statistics for all permanent job vacancies with remote or hybrid options requiring process or methodology skills.

Permanent vacancies with a requirement for process or methodology skills 15,184 17,775 22,099
As % of all permanent jobs with a WFH option 93.66% 87.96% 95.12%
Number of salaries quoted 8,293 10,730 17,884
10th Percentile £29,750 £35,750 £37,500
25th Percentile £40,000 £45,500 £47,500
Median annual salary (50th Percentile) £57,500 £61,500 £62,500
Median % change year-on-year -6.50% -1.60% -
75th Percentile £77,500 £81,250 £80,627
90th Percentile £100,000 £102,500 £97,500
UK median annual salary £54,500 £60,000 £60,000
% change year-on-year -9.17% - -

Presales
Job Vacancy Trend for Remote/Hybrid Jobs

Historical trend showing the proportion of permanent IT job postings citing Presales and offering remote or hybrid work options relative to all permanent IT jobs advertised.
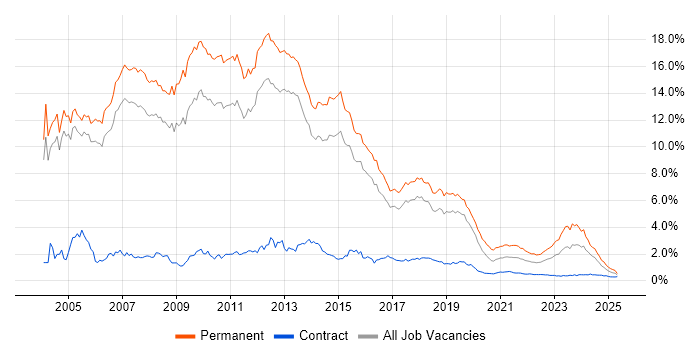
Presales job vacancy trend for remote/hybrid jobs

Presales
Salary Trend for Remote/Hybrid Jobs

Salary distribution trend for jobs with remote/hybrid work options citing Presales.

Salary distribution trend for jobs with remote/hybrid work options citing Presales

Presales
Salary Histogram for Remote/Hybrid Jobs

Salary distribution for jobs with remote/hybrid work options citing Presales over the 6 months to 20 October 2025.

Presales salary histogram for jobs with remote/hybrid work options

Presales
Co-Occurring Skills & Capabilities in Remote/Hybrid Jobs by Category

The following tables expand on the one above by listing co-occurrences grouped by category. They cover the same employment type, locality and period, with up to 20 co-occurrences shown in each category:

Application Platforms
1 6 (2.71%) Microsoft Exchange
2 5 (2.26%) Confluence
3 3 (1.36%) HCL Domino
3 3 (1.36%) HCL Notes
4 2 (0.90%) Apache
4 2 (0.90%) Apache Spark
4 2 (0.90%) SharePoint
5 1 (0.45%) CMS
5 1 (0.45%) Headless CMS
Applications
1 6 (2.71%) Microsoft Excel
2 4 (1.81%) Microsoft PowerPoint
3 3 (1.36%) MS Visio
4 1 (0.45%) Microsoft Project
Business Applications
1 18 (8.14%) SAP S/4HANA
2 5 (2.26%) Salesforce CRM
3 4 (1.81%) Dynamics CRM
4 3 (1.36%) NetSuite
4 3 (1.36%) Unit4 Business World
5 2 (0.90%) Oracle Cash Management
5 2 (0.90%) Oracle ERP
5 2 (0.90%) Oracle General Ledger
5 2 (0.90%) Oracle Payables
5 2 (0.90%) Oracle Receivables
5 2 (0.90%) SAP HCM
6 1 (0.45%) Dynamics AX
6 1 (0.45%) SAP APO
6 1 (0.45%) SAP EWM
6 1 (0.45%) SAP LE
6 1 (0.45%) SAP MM
6 1 (0.45%) SAP PP
6 1 (0.45%) SAP QM
6 1 (0.45%) SAP SCM
6 1 (0.45%) SAP SD
Cloud Services
1 52 (23.53%) Azure
2 30 (13.57%) Power Platform
2 30 (13.57%) SaaS
3 28 (12.67%) AWS
4 23 (10.41%) Microsoft 365
5 11 (4.98%) Dynamics 365
6 10 (4.52%) IaaS
7 9 (4.07%) Azure DevOps
8 8 (3.62%) GCP
9 7 (3.17%) Microsoft Copilot
10 4 (1.81%) Alation
10 4 (1.81%) Cloud Composer
10 4 (1.81%) GitHub
10 4 (1.81%) OCI
10 4 (1.81%) PaaS
10 4 (1.81%) Power Automate
10 4 (1.81%) Serverless
10 4 (1.81%) Snowflake
11 3 (1.36%) PowerApps
12 2 (0.90%) AWS Step Functions
Communications & Networking
1 8 (3.62%) Firewall
1 8 (3.62%) WAN
2 7 (3.17%) SD-WAN
3 6 (2.71%) MPLS
3 6 (2.71%) SAN
4 5 (2.26%) Network Security
5 4 (1.81%) VPN
6 3 (1.36%) LAN
6 3 (1.36%) VoIP
6 3 (1.36%) Wi-Fi
7 2 (0.90%) BGP
7 2 (0.90%) Internet
7 2 (0.90%) S/MIME
7 2 (0.90%) SSL
7 2 (0.90%) TCP/IP
7 2 (0.90%) X.509
8 1 (0.45%) EIGRP
8 1 (0.45%) IGRP
8 1 (0.45%) OSPF
8 1 (0.45%) VRRP
Database & Business Intelligence
1 11 (4.98%) Power BI
2 9 (4.07%) Data Warehouse
3 7 (3.17%) Data Lake
4 4 (1.81%) BigQuery
4 4 (1.81%) DataStage
4 4 (1.81%) Metadata
4 4 (1.81%) QlikView
4 4 (1.81%) Tableau
5 3 (1.36%) Oracle Database
6 2 (0.90%) Amazon Athena
6 2 (0.90%) Amazon Redshift
6 2 (0.90%) Big Data
7 1 (0.45%) Azure SQL Database
Development Applications
1 8 (3.62%) JIRA
2 4 (1.81%) ER Studio
2 4 (1.81%) ERwin
2 4 (1.81%) PowerDesigner
General
1 82 (37.10%) Social Skills
2 60 (27.15%) Finance
3 34 (15.38%) Presentation Skills
4 28 (12.67%) Public Sector
5 25 (11.31%) Marketing
6 18 (8.14%) Retail
7 15 (6.79%) Manufacturing
8 13 (5.88%) Inclusion and Diversity
8 13 (5.88%) Organisational Skills
9 11 (4.98%) Back Office
10 9 (4.07%) Documentation Skills
11 6 (2.71%) Banking
11 6 (2.71%) Legal
12 5 (2.26%) Analytical Skills
12 5 (2.26%) Billing
12 5 (2.26%) Czech Language
12 5 (2.26%) Law
13 4 (1.81%) Advertising
13 4 (1.81%) Retail Banking
13 4 (1.81%) Telecoms
Job Titles
1 73 (33.03%) Consultant
2 56 (25.34%) Architect
3 45 (20.36%) Solutions Architect
4 24 (10.86%) Senior
5 20 (9.05%) Senior Consultant
6 17 (7.69%) Presales Consultant
7 16 (7.24%) SAP Architect
7 16 (7.24%) SAP Solutions Architect
8 15 (6.79%) IT Consultant
9 14 (6.33%) Lead
10 13 (5.88%) Power Platform Consultant
11 9 (4.07%) Data Consultant
11 9 (4.07%) Presales Solution Architect
12 8 (3.62%) Project Manager
12 8 (3.62%) SAP S/4HANA Architect
13 7 (3.17%) Delivery Manager
13 7 (3.17%) IT Manager
13 7 (3.17%) Sales Executive
13 7 (3.17%) Solutions Consultant
14 5 (2.26%) IT Sales Executive
Libraries, Frameworks & Software Standards
1 10 (4.52%) SAP Fiori
2 5 (2.26%) SAML
3 3 (1.36%) .NET
3 3 (1.36%) EDI
4 2 (0.90%) EJB
4 2 (0.90%) PySpark
4 2 (0.90%) Regular Expression
4 2 (0.90%) REST
5 1 (0.45%) SAPUI5
5 1 (0.45%) SOAP
Miscellaneous
1 11 (4.98%) Web Conferencing
2 10 (4.52%) Greenfield Project
3 8 (3.62%) Hybrid Cloud
4 7 (3.17%) Data Centre
4 7 (3.17%) Onboarding
4 7 (3.17%) PKI
5 5 (2.26%) Cloud Native
6 4 (1.81%) Management Information System
6 4 (1.81%) Reinsurance
6 4 (1.81%) Self-Motivation
6 4 (1.81%) Virtual Team
7 3 (1.36%) Enterprise Software
7 3 (1.36%) FMCG
7 3 (1.36%) PACS
8 2 (0.90%) Algorithms
8 2 (0.90%) Derivative
8 2 (0.90%) e-Learning
8 2 (0.90%) Foreign Exchange (FX)
8 2 (0.90%) Private Cloud
9 1 (0.45%) Blog
Operating Systems
1 11 (4.98%) Windows
2 7 (3.17%) Windows Server
3 4 (1.81%) Linux
4 1 (0.45%) Check Point GAiA
4 1 (0.45%) Red Hat Enterprise Linux
Processes & Methodologies
1 40 (18.10%) Problem-Solving
2 39 (17.65%) Roadmaps
3 38 (17.19%) AI
4 35 (15.84%) Agile
5 28 (12.67%) Project Delivery
6 27 (12.22%) Continuous Improvement
7 25 (11.31%) Analytics
7 25 (11.31%) Decision-Making
8 23 (10.41%) Business Development
8 23 (10.41%) Logistics
9 22 (9.95%) Stakeholder Management
10 21 (9.50%) DevOps
11 20 (9.05%) Business Intelligence
11 20 (9.05%) Mentoring
12 17 (7.69%) Stakeholder Engagement
12 17 (7.69%) Use Case
13 16 (7.24%) ERP
14 15 (6.79%) Cybersecurity
14 15 (6.79%) ITIL
15 14 (6.33%) Service Delivery
Programming Languages
1 10 (4.52%) SQL
2 5 (2.26%) Python
3 4 (1.81%) PowerShell
4 2 (0.90%) Java
5 1 (0.45%) Bash
5 1 (0.45%) Bicep
5 1 (0.45%) Kusto Query Language
Qualifications
1 37 (16.74%) Security Cleared
2 30 (13.57%) Degree
3 26 (11.76%) SC Cleared
4 21 (9.50%) Azure Certification
5 15 (6.79%) Master's Degree
6 14 (6.33%) AWS Certification
7 10 (4.52%) Cisco Certification
8 9 (4.07%) CCNA
9 8 (3.62%) CCNP
9 8 (3.62%) Computer Science Degree
10 7 (3.17%) DV Cleared
10 7 (3.17%) SAP Certification
11 6 (2.71%) CISM
11 6 (2.71%) CISSP
11 6 (2.71%) MBA
12 5 (2.26%) Microsoft Certification
12 5 (2.26%) VMware Certified Professional (VCP)
13 4 (1.81%) CISMP
13 4 (1.81%) CRISC
13 4 (1.81%) ISO 27001 Lead Auditor
Quality Assurance & Compliance
1 14 (6.33%) QA
2 11 (4.98%) Data Quality
3 9 (4.07%) ISO/IEC 27001
4 8 (3.62%) NIST
5 6 (2.71%) Cyber Essentials
5 6 (2.71%) GDPR
6 5 (2.26%) SLA
7 4 (1.81%) GRC
7 4 (1.81%) JSP 440
7 4 (1.81%) NIST 800
8 3 (1.36%) ISO 9001
8 3 (1.36%) NCSC
9 2 (0.90%) Cyber Essentials PLUS
10 1 (0.45%) GxP
System Software
1 8 (3.62%) Active Directory
2 7 (3.17%) Hyper-V
3 5 (2.26%) VMware ESXi
4 3 (1.36%) Docker
4 3 (1.36%) VMware Infrastructure
5 1 (0.45%) Firmware
5 1 (0.45%) Virtual Desktop
Systems Management
1 11 (4.98%) Terraform
2 7 (3.17%) Kubernetes
3 5 (2.26%) Automic
3 5 (2.26%) Microsoft Intune
3 5 (2.26%) Single Sign-On
4 2 (0.90%) Computer Emergency Response Teams
5 1 (0.45%) Ansible
5 1 (0.45%) Autotask
5 1 (0.45%) FortiGate
5 1 (0.45%) OpenView
5 1 (0.45%) Tivoli
Vendors
1 52 (23.53%) Microsoft
2 32 (14.48%) SAP
3 16 (7.24%) Cisco
4 11 (4.98%) Fortinet
5 10 (4.52%) Oracle
6 9 (4.07%) VMware
7 8 (3.62%) Ariba
7 8 (3.62%) IBM
8 6 (2.71%) Databricks
8 6 (2.71%) Veeam
9 5 (2.26%) Broadcom
9 5 (2.26%) Juniper
9 5 (2.26%) Salesforce
10 4 (1.81%) Google
10 4 (1.81%) Informatica
10 4 (1.81%) ServiceNow
11 3 (1.36%) Anaplan
11 3 (1.36%) Dell
11 3 (1.36%) Lotus
11 3 (1.36%) Palo Alto