Perl Contracts in England

Perl
UK > England

The table below provides summary statistics for contract job vacancies advertised in England requiring Perl skills. It includes a benchmarking guide to the contractor rates offered in vacancies that cited Perl over the 6 months leading up to 1 May 2025, comparing them to the same period in the previous two years.

6 months to
1 May 2025
Same period 2024 Same period 2023
Rank 359 367 306
Rank change year-on-year +8 -61 +138
Contract jobs citing Perl 126 177 406
As % of all contract jobs advertised in England 0.52% 0.48% 0.80%
As % of the Programming Languages category 1.53% 1.62% 2.28%
Number of daily rates quoted 79 121 249
10th Percentile £393 £419 £425
25th Percentile £425 £475 £500
Median daily rate (50th Percentile) £531 £550 £600
Median % change year-on-year -3.41% -8.33% +14.29%
75th Percentile £584 £625 £700
90th Percentile £674 £800 £775
UK median daily rate £525 £550 £560
% change year-on-year -4.55% -1.79% +6.67%
Number of hourly rates quoted 2 4 10
10th Percentile £63.65 £39.25 £37.80
25th Percentile £63.88 £43.75 £51.25
Median hourly rate £65.00 £55.50 £52.50
Median % change year-on-year +17.12% +5.71% +14.13%
75th Percentile £66.13 £66.13 £74.50
90th Percentile £66.35 £67.70 £74.65
UK median hourly rate £65.00 £55.50 £57.50
% change year-on-year +17.12% -3.48% +20.37%

All Programming Languages
England

Perl falls under the Programming Languages category. For comparison with the information above, the following table provides summary statistics for all contract job vacancies requiring coding skills in England.

Contract vacancies with a requirement for coding skills 8,221 10,920 17,806
As % of all contract IT jobs advertised in England 33.76% 29.36% 35.29%
Number of daily rates quoted 5,687 7,931 13,003
10th Percentile £363 £350 £388
25th Percentile £425 £425 £463
Median daily rate (50th Percentile) £525 £540 £565
Median % change year-on-year -2.78% -4.42% +2.73%
75th Percentile £650 £652 £688
90th Percentile £788 £775 £798
UK median daily rate £525 £525 £550
% change year-on-year - -4.55% -
Number of hourly rates quoted 214 441 430
10th Percentile £25.25 £35.52 £26.24
25th Percentile £37.65 £48.00 £50.00
Median hourly rate £62.75 £62.50 £61.84
Median % change year-on-year +0.40% +1.07% +23.68%
75th Percentile £68.00 £70.00 £70.00
90th Percentile £85.00 £80.00 £77.00
UK median hourly rate £62.50 £60.50 £60.70
% change year-on-year +3.31% -0.33% +21.40%

Perl
Job Vacancy Trend in England

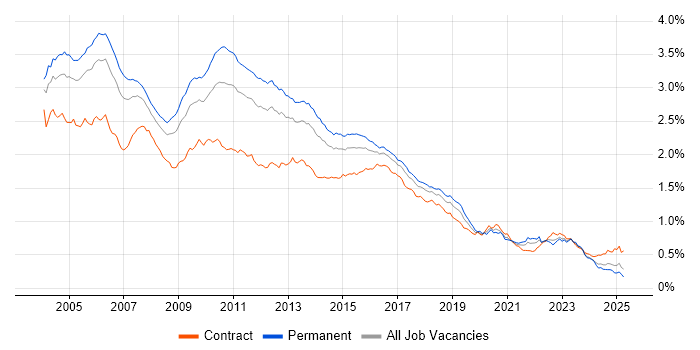
Job postings citing Perl as a proportion of all IT jobs advertised in England.

Job vacancy trend for Perl in England

Perl
Contractor Daily Rate Trend in England

3-month moving average daily rate quoted in jobs citing Perl in England.

Daily rate trend for Perl in England

Perl
Daily Rate Histogram in England

Daily rate distribution for jobs citing Perl in England over the 6 months to 1 May 2025.

Daily rate histogram for Perl in England

Perl
Contractor Hourly Rate Trend in England

3-month moving average hourly rates quoted in jobs citing Perl in England.

Hourly rate trend for Perl in England

Perl
Contract Job Locations in England

The table below looks at the demand and provides a guide to the median contractor rates quoted in IT jobs citing Perl within the England region over the 6 months to 1 May 2025. The 'Rank Change' column provides an indication of the change in demand within each location based on the same 6 month period last year.

Location Rank Change
on Same Period
Last Year
Matching
Contract
IT Job Ads
Median
Daily Rate
Past 6 Months
Median Daily Rate
% Change
on Same Period
Last Year
Live
Jobs
London -17 53 £550 -8.33% 75
North of England +23 28 £538 +4.37% 29
South East +43 23 £526 +7.90% 47
Yorkshire +19 18 £550 +23.60% 11
North West +10 10 £393 -23.69% 16
Midlands +20 7 £506 +40.85% 23
South West +47 6 £700 +51.35% 22
East of England - 6 £283 - 44
West Midlands +16 5 - - 14
East Midlands +6 2 £506 +42.13% 7
Perl
UK

Perl
Co-occurring Skills and Capabilities in England by Category

The follow tables expand on the table above by listing co-occurrences grouped by category. The same employment type, locality and period is covered with up to 20 co-occurrences shown in each of the following categories:

Application Platforms
1 14 (11.11%) Oracle SOA Suite
2 9 (7.14%) JBoss
3 7 (5.56%) Confluence
4 5 (3.97%) Apache Spark
5 4 (3.17%) Apache
6 3 (2.38%) SharePoint
7 2 (1.59%) Microsoft Exchange
8 1 (0.79%) IIS
8 1 (0.79%) nginx
8 1 (0.79%) Tomcat
Applications
1 5 (3.97%) MS Visio
2 4 (3.17%) Microsoft Office
3 2 (1.59%) Microsoft Project
Business Applications
1 3 (2.38%) Fidessa
2 2 (1.59%) Oracle 11i
3 1 (0.79%) Oracle Payables
Cloud Services
1 41 (32.54%) AWS
2 29 (23.02%) Azure
3 16 (12.70%) GitHub
4 12 (9.52%) OpenShift
5 11 (8.73%) GCP
6 7 (5.56%) Nutanix
7 6 (4.76%) Serverless
8 5 (3.97%) AWS Lambda
8 5 (3.97%) Azure DevOps
9 4 (3.17%) SaaS
10 3 (2.38%) Amazon Cognito
10 3 (2.38%) Amazon EKS
10 3 (2.38%) Azure API Management
10 3 (2.38%) Cloud Computing
10 3 (2.38%) Kong
11 2 (1.59%) Amazon MSK
11 2 (1.59%) AWS Step Functions
11 2 (1.59%) IaaS
11 2 (1.59%) PaaS
12 1 (0.79%) Amazon ELB
Communications & Networking
1 45 (35.71%) DNS
2 16 (12.70%) TCP/IP
3 14 (11.11%) Firewall
4 12 (9.52%) DHCP
5 9 (7.14%) VPN
6 7 (5.56%) BGP
6 7 (5.56%) OSPF
7 5 (3.97%) HTTP
7 5 (3.97%) IPsec
7 5 (3.97%) MPLS
7 5 (3.97%) Multicast
7 5 (3.97%) Network Security
7 5 (3.97%) SSL
8 4 (3.17%) EIGRP
8 4 (3.17%) Internet
8 4 (3.17%) SSH
8 4 (3.17%) Wi-Fi
9 3 (2.38%) DMZ
9 3 (2.38%) DWDM
9 3 (2.38%) L2TP
Database & Business Intelligence
1 22 (17.46%) Oracle Database
2 14 (11.11%) Relational Database
2 14 (11.11%) SQL Server
3 10 (7.94%) RDBMS
4 9 (7.14%) Elasticsearch
5 7 (5.56%) MongoDB
6 6 (4.76%) GIS
6 6 (4.76%) PostgreSQL
7 5 (3.97%) Amazon RDS
7 5 (3.97%) Big Data
7 5 (3.97%) DB2
7 5 (3.97%) DynamoDB
7 5 (3.97%) Hadoop
8 4 (3.17%) Apache Cassandra
8 4 (3.17%) MySQL
8 4 (3.17%) SQL Server Reporting Services
9 3 (2.38%) Hazelcast
9 3 (2.38%) Redis
10 2 (1.59%) Amazon Redshift
10 2 (1.59%) MariaDB
Development Applications
1 25 (19.84%) Git
2 20 (15.87%) JIRA
3 19 (15.08%) Jenkins
4 18 (14.29%) TeamCity
5 12 (9.52%) SonarQube
6 11 (8.73%) Subversion
7 10 (7.94%) Sonatype Nexus
8 9 (7.14%) Bitbucket Server
8 9 (7.14%) CA Release Automation
9 5 (3.97%) Maven
10 4 (3.17%) Artifactory
10 4 (3.17%) Bitbucket
10 4 (3.17%) GitLab
11 3 (2.38%) Ant
11 3 (2.38%) Snyk
11 3 (2.38%) Toad
12 2 (1.59%) SoapUI
13 1 (0.79%) Gatling
13 1 (0.79%) JUnit
13 1 (0.79%) TestDirector
General
1 44 (34.92%) Social Skills
2 28 (22.22%) Finance
3 18 (14.29%) Banking
4 10 (7.94%) Analytical Skills
5 7 (5.56%) Public Sector
6 6 (4.76%) Telecoms
7 4 (3.17%) Documentation Skills
7 4 (3.17%) Financial Institution
7 4 (3.17%) Investment Banking
7 4 (3.17%) Presentation Skills
8 3 (2.38%) Aerospace
9 2 (1.59%) Front Office
9 2 (1.59%) Retail
10 1 (0.79%) Arabic Language
10 1 (0.79%) French Language
10 1 (0.79%) German Language
10 1 (0.79%) Japanese Language
10 1 (0.79%) Korean Language
10 1 (0.79%) Military
10 1 (0.79%) Spanish Language
Job Titles
1 18 (14.29%) Administrator
2 16 (12.70%) Developer
2 16 (12.70%) Infrastructure Engineer
3 14 (11.11%) Linux Administrator
4 11 (8.73%) Consultant
4 11 (8.73%) Network Engineer
5 9 (7.14%) Infrastructure Specialist
6 8 (6.35%) Engineering Specialist
6 8 (6.35%) Linux Engineer
7 6 (4.76%) Network Infrastructure Engineer
8 5 (3.97%) Java Developer
8 5 (3.97%) Solutions Consultant
8 5 (3.97%) Systems Engineer
9 4 (3.17%) Applications Support
9 4 (3.17%) AWS DevOps
9 4 (3.17%) Cisco Engineer
9 4 (3.17%) Cisco Network Engineer
9 4 (3.17%) DevOps Engineer
9 4 (3.17%) Software Engineer
9 4 (3.17%) Tester
Libraries, Frameworks & Software Standards
1 12 (9.52%) Elastic Stack
2 9 (7.14%) Kafka
2 9 (7.14%) SOAP
2 9 (7.14%) Spring
2 9 (7.14%) Spring Boot
3 8 (6.35%) REST
4 7 (5.56%) AngularJS
5 6 (4.76%) JSON
5 6 (4.76%) Middleware
5 6 (4.76%) Node.js
5 6 (4.76%) XML
6 5 (3.97%) React
7 4 (3.17%) RESTful
7 4 (3.17%) Web Services
8 3 (2.38%) 802.1X
8 3 (2.38%) ActiveMQ
8 3 (2.38%) FIX Protocol
8 3 (2.38%) IBM Integration Bus
8 3 (2.38%) J2EE
8 3 (2.38%) LDAP
Miscellaneous
1 18 (14.29%) Linux Command Line
2 14 (11.11%) Clustering
3 13 (10.32%) SCADA
4 12 (9.52%) Replication
5 9 (7.14%) Operational Technology
6 5 (3.97%) Data Centre
6 5 (3.97%) Public Cloud
7 4 (3.17%) Product Ownership
8 3 (2.38%) Data Protection Act
8 3 (2.38%) Equities
8 3 (2.38%) Eurex
8 3 (2.38%) Virtual Team
9 2 (1.59%) Fixed Income
9 2 (1.59%) Foreign Exchange (FX)
9 2 (1.59%) Hybrid Cloud
9 2 (1.59%) Management Information System
9 2 (1.59%) SWIFT Messaging Network
10 1 (0.79%) Enterprise Cloud
10 1 (0.79%) Enterprise Software
10 1 (0.79%) SystemC
Operating Systems
1 81 (64.29%) Linux
2 48 (38.10%) Windows
3 28 (22.22%) Unix
4 21 (16.67%) Windows Server
5 19 (15.08%) Red Hat Enterprise Linux
6 16 (12.70%) Solaris
7 7 (5.56%) AIX
7 7 (5.56%) CentOS
8 5 (3.97%) Ubuntu
9 3 (2.38%) SUSE
10 2 (1.59%) HPUX
10 2 (1.59%) Rocky
11 1 (0.79%) Debian
11 1 (0.79%) Fedora
11 1 (0.79%) Oracle Linux
11 1 (0.79%) Windows 10
11 1 (0.79%) Windows 8
11 1 (0.79%) Windows Server 2012
11 1 (0.79%) Windows Server 2016
Processes & Methodologies
1 38 (30.16%) DevOps
2 32 (25.40%) Problem-Solving
3 31 (24.60%) Agile
4 30 (23.81%) Microservices
5 29 (23.02%) CI/CD
6 26 (20.63%) Infrastructure Engineering
7 24 (19.05%) High Availability
8 23 (18.25%) Migration
9 17 (13.49%) Disaster Recovery
10 15 (11.90%) Security Management
10 15 (11.90%) SOA
10 15 (11.90%) Task Automation
11 14 (11.11%) Deployment Automation
11 14 (11.11%) Server Management
12 13 (10.32%) Roadmaps
13 12 (9.52%) Containerisation
13 12 (9.52%) Continuous Integration
14 11 (8.73%) Infrastructure as Code
15 10 (7.94%) Computer Science
16 9 (7.14%) Build Automation
Programming Languages
1 81 (64.29%) Python
2 54 (42.86%) Bash
3 50 (39.68%) SQL
4 34 (26.98%) PL/SQL
5 30 (23.81%) PowerShell
6 26 (20.63%) Java
7 18 (14.29%) Shell Script
8 14 (11.11%) JavaScript
9 6 (4.76%) PHP
10 5 (3.97%) Korn
10 5 (3.97%) Ruby
11 4 (3.17%) Scala
11 4 (3.17%) Tcl
11 4 (3.17%) TypeScript
12 3 (2.38%) ABAP
12 3 (2.38%) C#
13 2 (1.59%) C++
13 2 (1.59%) Groovy
13 2 (1.59%) Lua
14 1 (0.79%) ActionScript 2.0
Qualifications
1 38 (30.16%) Security Cleared
2 29 (23.02%) SC Cleared
3 22 (17.46%) Cisco Certification
4 18 (14.29%) Degree
5 9 (7.14%) Computer Science Degree
6 5 (3.97%) CCNP
7 3 (2.38%) BPSS Clearance
7 3 (2.38%) CCIE
7 3 (2.38%) SANS
8 1 (0.79%) A+ Certification
8 1 (0.79%) CEH
8 1 (0.79%) CISSP
8 1 (0.79%) CREST Certified
8 1 (0.79%) CTC Cleared
8 1 (0.79%) IBM Certification
8 1 (0.79%) Master's Degree
8 1 (0.79%) MCITP
8 1 (0.79%) Microsoft Certification
8 1 (0.79%) OSCP
8 1 (0.79%) Sun Certification
Quality Assurance & Compliance
1 10 (7.94%) GDPR
2 8 (6.35%) Sarbanes-Oxley
3 3 (2.38%) QA
4 2 (1.59%) SEPA
5 1 (0.79%) Data Quality
5 1 (0.79%) PCI DSS
System Software
1 30 (23.81%) Active Directory
2 23 (18.25%) Docker
3 12 (9.52%) VMware Infrastructure
4 11 (8.73%) VMware ESXi
5 4 (3.17%) NFS
5 4 (3.17%) Veritas File System
5 4 (3.17%) Veritas Volume Manager
6 2 (1.59%) KVM
6 2 (1.59%) vSphere
7 1 (0.79%) Apache Flume
7 1 (0.79%) Oracle RAC
7 1 (0.79%) Tivoli Workload Scheduler
7 1 (0.79%) Virtual Machines
7 1 (0.79%) XenApp
Systems Management
1 39 (30.95%) Ansible
2 24 (19.05%) Kubernetes
3 22 (17.46%) Progress Chef
4 16 (12.70%) Terraform
5 13 (10.32%) Puppet
6 12 (9.52%) Red Hat Satellite
7 9 (7.14%) Kibana
7 9 (7.14%) Prometheus
7 9 (7.14%) QRadar
8 8 (6.35%) Grafana
8 8 (6.35%) Tivoli
9 7 (5.56%) Control-M
10 6 (4.76%) Rundeck
11 5 (3.97%) EMC NetWorker
11 5 (3.97%) Tivoli Storage Manager
12 3 (2.38%) Istio
12 3 (2.38%) ZABBIX
13 2 (1.59%) Failover Clustering
13 2 (1.59%) Foglight
13 2 (1.59%) SELinux
Vendors
1 39 (30.95%) Oracle
2 36 (28.57%) Red Hat
3 26 (20.63%) Splunk
4 25 (19.84%) Cisco
5 21 (16.67%) VMware
6 19 (15.08%) IBM
7 9 (7.14%) AppDynamics
7 9 (7.14%) CyberArk
7 9 (7.14%) Qualys
8 8 (6.35%) Microsoft
8 8 (6.35%) SaltStack
9 7 (5.56%) EMC
9 7 (5.56%) Sybase
10 6 (4.76%) Google
11 5 (3.97%) BMC
11 5 (3.97%) ServiceNow
12 4 (3.17%) Arista
12 4 (3.17%) Bloomberg
12 4 (3.17%) Fortinet
12 4 (3.17%) SAP