Disaster Recovery Contracts in London

Disaster Recovery
England > London

The table below provides summary statistics for contract job vacancies advertised in London requiring Disaster Recovery skills. It includes a benchmarking guide to the contractor rates offered in vacancies that cited Disaster Recovery over the 6 months leading up to 1 May 2025, comparing them to the same period in the previous two years.

6 months to
1 May 2025
Same period 2024 Same period 2023
Rank 207 168 264
Rank change year-on-year -39 +96 +7
Contract jobs citing Disaster Recovery 148 255 250
As % of all contract jobs advertised in London 1.18% 1.43% 0.92%
As % of the Processes & Methodologies category 1.28% 1.61% 1.01%
Number of daily rates quoted 103 201 180
10th Percentile £385 £300 £363
25th Percentile £402 £383 £400
Median daily rate (50th Percentile) £500 £494 £495
Median % change year-on-year +1.24% -0.22% -1.00%
75th Percentile £634 £638 £585
90th Percentile £715 £700 £688
England median daily rate £476 £500 £525
% change year-on-year -4.90% -4.76% +6.06%
Number of hourly rates quoted 3 4 0
10th Percentile - £22.54 -
25th Percentile £20.24 £23.35 -
Median hourly rate £21.63 £23.80 -
Median % change year-on-year -9.14% - -
75th Percentile £23.01 £32.23 -
90th Percentile - £47.39 -
England median hourly rate £21.63 £58.30 £40.42
% change year-on-year -62.91% +44.25% -20.40%

All Process and Methodology Skills
London

Disaster Recovery falls under the Processes and Methodologies category. For comparison with the information above, the following table provides summary statistics for all contract job vacancies requiring process or methodology skills in London.

Contract vacancies with a requirement for process or methodology skills 11,564 15,790 24,631
As % of all contract IT jobs advertised in London 92.16% 88.55% 91.11%
Number of daily rates quoted 7,847 11,316 17,711
10th Percentile £350 £338 £375
25th Percentile £440 £450 £475
Median daily rate (50th Percentile) £550 £550 £590
Median % change year-on-year - -6.78% +2.61%
75th Percentile £688 £675 £700
90th Percentile £813 £800 £800
England median daily rate £525 £525 £550
% change year-on-year - -4.55% +2.33%
Number of hourly rates quoted 166 324 278
10th Percentile £16.17 £16.00 £18.59
25th Percentile £22.68 £20.00 £22.53
Median hourly rate £31.67 £29.50 £38.13
Median % change year-on-year +7.36% -22.62% +5.90%
75th Percentile £50.75 £47.56 £62.64
90th Percentile £63.75 £65.93 £76.78
England median hourly rate £29.07 £36.00 £37.50
% change year-on-year -19.25% -4.00% +53.06%

Disaster Recovery
Job Vacancy Trend in London

Job postings citing Disaster Recovery as a proportion of all IT jobs advertised in London.
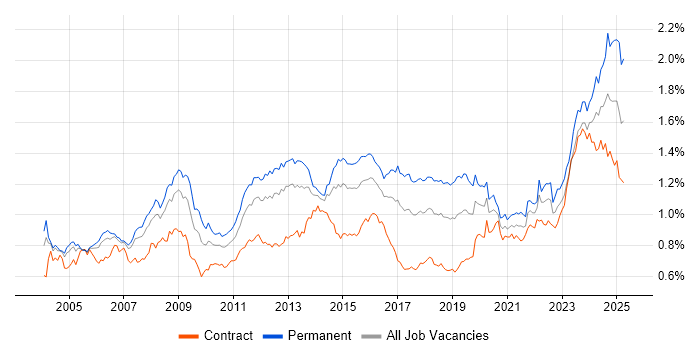
Job vacancy trend for Disaster Recovery in London

Disaster Recovery
Contractor Daily Rate Trend in London

3-month moving average daily rate quoted in jobs citing Disaster Recovery in London.

Daily rate trend for Disaster Recovery in London

Disaster Recovery
Daily Rate Histogram in London

Daily rate distribution for jobs citing Disaster Recovery in London over the 6 months to 1 May 2025.

Daily rate histogram for Disaster Recovery in London

Disaster Recovery
Contractor Hourly Rate Trend in London

3-month moving average hourly rates quoted in jobs citing Disaster Recovery in London.

Hourly rate trend for Disaster Recovery in London

Disaster Recovery
Contract Job Locations in London

The table below looks at the demand and provides a guide to the median contractor rates quoted in IT jobs citing Disaster Recovery within the London region over the 6 months to 1 May 2025. The 'Rank Change' column provides an indication of the change in demand within each location based on the same 6 month period last year.

Location Rank Change
on Same Period
Last Year
Matching
Contract
IT Job Ads
Median
Daily Rate
Past 6 Months
Median Daily Rate
% Change
on Same Period
Last Year
Live
Jobs
Central London -18 22 £584 +51.62% 35
West London +12 3 - - 22
East London +4 3 £630 +26.00% 7
North London -4 2 £270 +8.00% 1
Disaster Recovery
England

Disaster Recovery
Co-occurring Skills and Capabilities in London by Category

The follow tables expand on the table above by listing co-occurrences grouped by category. The same employment type, locality and period is covered with up to 20 co-occurrences shown in each of the following categories:

Application Platforms
1 14 (9.46%) IIS
2 3 (2.03%) Confluence
2 3 (2.03%) OpenStack
2 3 (2.03%) SharePoint
3 2 (1.35%) Apache Airflow
3 2 (1.35%) Apache Spark
3 2 (1.35%) Microsoft Exchange
4 1 (0.68%) Apache
Applications
1 11 (7.43%) Microsoft Excel
2 4 (2.70%) Microsoft Office
Business Applications
1 5 (3.38%) Oracle Assets
1 5 (3.38%) Oracle EBS
1 5 (3.38%) Oracle E-Business Tax
1 5 (3.38%) Oracle General Ledger
1 5 (3.38%) Oracle Payables
2 1 (0.68%) BASE24
2 1 (0.68%) Oracle EBS R12
Cloud Services
1 44 (29.73%) Azure
2 34 (22.97%) AWS
3 20 (13.51%) GCP
4 15 (10.14%) GitHub
5 11 (7.43%) Nutanix
6 10 (6.76%) Azure DevOps
6 10 (6.76%) Entra ID
7 8 (5.41%) SaaS
7 8 (5.41%) Serverless
8 7 (4.73%) Cloud Computing
8 7 (4.73%) IaaS
9 5 (3.38%) Amazon ELB
9 5 (3.38%) AWS Lambda
9 5 (3.38%) Microsoft 365
9 5 (3.38%) PaaS
10 4 (2.70%) Amazon EKS
10 4 (2.70%) AWS CloudFormation
10 4 (2.70%) Azure Data Factory
10 4 (2.70%) OpenShift
10 4 (2.70%) Snowflake
Communications & Networking
1 19 (12.84%) DNS
2 13 (8.78%) Internet
3 12 (8.11%) Firewall
3 12 (8.11%) TCP/IP
4 9 (6.08%) VPN
5 8 (5.41%) DHCP
6 4 (2.70%) Kerberos
6 4 (2.70%) Network Security
6 4 (2.70%) SAN
6 4 (2.70%) SSL
6 4 (2.70%) WAN
7 3 (2.03%) HTTPS
7 3 (2.03%) LAN
7 3 (2.03%) NAS
7 3 (2.03%) Software-Defined Networking
7 3 (2.03%) SSH
7 3 (2.03%) Wireless
8 2 (1.35%) BGP
8 2 (1.35%) VLAN
8 2 (1.35%) VoIP
Database & Business Intelligence
1 29 (19.59%) SQL Server
2 18 (12.16%) Oracle Database
3 8 (5.41%) PostgreSQL
4 7 (4.73%) Amazon RDS
4 7 (4.73%) MongoDB
5 4 (2.70%) Azure SQL Database
5 4 (2.70%) Relational Database
6 3 (2.03%) Data Warehouse
6 3 (2.03%) MySQL
6 3 (2.03%) NoSQL
6 3 (2.03%) Sybase ASE
7 2 (1.35%) Data Lake
7 2 (1.35%) Oracle Database 12c
7 2 (1.35%) RDBMS
8 1 (0.68%) BigQuery
8 1 (0.68%) Cloudera CDH
8 1 (0.68%) DocumentDB
8 1 (0.68%) Metadata
8 1 (0.68%) Oracle Exadata
8 1 (0.68%) Power BI
Development Applications
1 9 (6.08%) Git
1 9 (6.08%) Jenkins
1 9 (6.08%) TeamCity
2 8 (5.41%) Subversion
3 5 (3.38%) JIRA
4 1 (0.68%) GitLab
4 1 (0.68%) Serena SBM
General
1 45 (30.41%) Finance
2 37 (25.00%) Social Skills
3 25 (16.89%) Banking
4 13 (8.78%) Analytical Skills
5 11 (7.43%) Public Sector
6 8 (5.41%) Investment Banking
7 7 (4.73%) Telecoms
8 5 (3.38%) General Ledger
8 5 (3.38%) Legal
8 5 (3.38%) Marketing
9 4 (2.70%) Electronics
9 4 (2.70%) Manufacturing
10 3 (2.03%) Documentation Skills
10 3 (2.03%) Financial Institution
10 3 (2.03%) Inclusion and Diversity
11 2 (1.35%) Organisational Skills
11 2 (1.35%) Retail Banking
12 1 (0.68%) Corporate Banking
12 1 (0.68%) International Banking
12 1 (0.68%) Retail
Job Titles
1 19 (12.84%) Administrator
1 19 (12.84%) Developer
2 17 (11.49%) C# Developer
3 15 (10.14%) Senior
4 14 (9.46%) DBA
4 14 (9.46%) Infrastructure Engineer
5 12 (8.11%) C# WPF Developer
5 12 (8.11%) WPF Developer
6 11 (7.43%) C# WCF Developer
6 11 (7.43%) WCF Developer
7 10 (6.76%) Architect
8 9 (6.08%) Azure Engineer
8 9 (6.08%) Linux Administrator
9 8 (5.41%) Cloud Engineer
9 8 (5.41%) DevOps Engineer
9 8 (5.41%) SQL DBA
10 7 (4.73%) Lead
11 6 (4.05%) .NET Developer
11 6 (4.05%) Consultant
11 6 (4.05%) Senior Infrastructure Engineer
Libraries, Frameworks & Software Standards
1 18 (12.16%) .NET
2 14 (9.46%) .NET Framework
3 13 (8.78%) WPF
4 12 (8.11%) REST
4 12 (8.11%) WinForms
5 11 (7.43%) WCF
6 4 (2.70%) Elastic Stack
6 4 (2.70%) LDAP
7 2 (1.35%) ARM Templates
7 2 (1.35%) AWS SAM
7 2 (1.35%) Middleware
7 2 (1.35%) RESTful
7 2 (1.35%) SOAP
8 1 (0.68%) GraphQL
8 1 (0.68%) Node.js
8 1 (0.68%) PySpark
8 1 (0.68%) SailPoint
8 1 (0.68%) Serverless Framework
8 1 (0.68%) TypeORM
8 1 (0.68%) YAML
Miscellaneous
1 17 (11.49%) Clustering
1 17 (11.49%) Replication
2 10 (6.76%) Onboarding
3 8 (5.41%) Hybrid Cloud
4 7 (4.73%) Management Information System
5 6 (4.05%) Data Centre
5 6 (4.05%) Data Protection Act
6 4 (2.70%) Private Cloud
7 3 (2.03%) Linux Command Line
7 3 (2.03%) PKI
7 3 (2.03%) Security Posture
7 3 (2.03%) Self-Motivation
8 2 (1.35%) Data Structures
8 2 (1.35%) Distributed Systems
8 2 (1.35%) Legacy Applications
8 2 (1.35%) Legacy Systems
8 2 (1.35%) NHS
8 2 (1.35%) Public Cloud
8 2 (1.35%) Team-Oriented Environment
8 2 (1.35%) Virtual Team
Operating Systems
1 51 (34.46%) Windows
2 25 (16.89%) Linux
3 21 (14.19%) Windows Server
4 10 (6.76%) Unix
5 9 (6.08%) Solaris
6 6 (4.05%) Red Hat Enterprise Linux
7 2 (1.35%) VMS
8 1 (0.68%) Mac OS
8 1 (0.68%) OpenVMS
8 1 (0.68%) Oracle Linux
8 1 (0.68%) Windows Server 2016
8 1 (0.68%) Windows Server 2019
Processes & Methodologies
1 54 (36.49%) High Availability
2 39 (26.35%) DevOps
3 33 (22.30%) Problem-Solving
4 31 (20.95%) Business Continuity
5 25 (16.89%) CI/CD
5 25 (16.89%) ITIL
6 22 (14.86%) Migration
6 22 (14.86%) Performance Tuning
7 19 (12.84%) Infrastructure as Code
8 18 (12.16%) Project Management
9 17 (11.49%) Agile
10 16 (10.81%) Data Analysis
11 15 (10.14%) Infrastructure Engineering
12 14 (9.46%) Cybersecurity
12 14 (9.46%) Data Security
12 14 (9.46%) Stakeholder Management
13 12 (8.11%) Containerisation
14 11 (7.43%) Storage Management
14 11 (7.43%) Task Automation
14 11 (7.43%) Validation
Programming Languages
1 43 (29.05%) SQL
2 41 (27.70%) Python
3 27 (18.24%) PowerShell
4 20 (13.51%) Bash
4 20 (13.51%) C#
5 16 (10.81%) T-SQL
6 15 (10.14%) PL/SQL
7 11 (7.43%) VB
7 11 (7.43%) VBA
8 8 (5.41%) Perl
9 4 (2.70%) ActionScript
9 4 (2.70%) ActionScript 2.0
9 4 (2.70%) C
9 4 (2.70%) Java
10 3 (2.03%) Bicep
10 3 (2.03%) JavaScript
11 2 (1.35%) Go
11 2 (1.35%) Shell Script
12 1 (0.68%) Groovy
12 1 (0.68%) Scala
Qualifications
1 17 (11.49%) Security Cleared
2 13 (8.78%) SC Cleared
3 10 (6.76%) Degree
4 4 (2.70%) ITIL Certification
5 3 (2.03%) CISSP
5 3 (2.03%) DBS Check
5 3 (2.03%) DV Cleared
5 3 (2.03%) RHCSA
5 3 (2.03%) VCAP
6 2 (1.35%) AWS Certification
6 2 (1.35%) AWS Certified Solutions Architect
6 2 (1.35%) Azure Certification
6 2 (1.35%) CCNA
6 2 (1.35%) Cisco Certification
6 2 (1.35%) Computer Science Degree
6 2 (1.35%) Microsoft Certification
7 1 (0.68%) AWS Certified DevOps Engineer
7 1 (0.68%) CompTIA Security+
7 1 (0.68%) ISO 27001 Lead Auditor
7 1 (0.68%) PRINCE2 Certification
Quality Assurance & Compliance
1 17 (11.49%) GDPR
2 16 (10.81%) QA
3 10 (6.76%) ISO/IEC 27001
3 10 (6.76%) Sarbanes-Oxley
4 4 (2.70%) NCSC
4 4 (2.70%) NIST
5 3 (2.03%) Data Quality
5 3 (2.03%) GRC
5 3 (2.03%) ISO 22301
5 3 (2.03%) PCI DSS
6 2 (1.35%) Accessibility
6 2 (1.35%) Cyber Essentials
6 2 (1.35%) DICOM
6 2 (1.35%) HIPAA
6 2 (1.35%) HL7
7 1 (0.68%) 21 CFR Part 11
7 1 (0.68%) GxP
7 1 (0.68%) ISO 31000
7 1 (0.68%) ISO 8583
System Software
1 22 (14.86%) Active Directory
2 16 (10.81%) Docker
3 10 (6.76%) VMware Infrastructure
4 9 (6.08%) Virtual Machines
4 9 (6.08%) VMware ESXi
5 4 (2.70%) NFS
6 3 (2.03%) Veritas File System
6 3 (2.03%) Veritas Volume Manager
6 3 (2.03%) Virtual Servers
6 3 (2.03%) VMware NSX
7 2 (1.35%) Oracle RAC
8 1 (0.68%) Firmware
8 1 (0.68%) Virtual Desktop
8 1 (0.68%) VMware Workstation
Systems Management
1 30 (20.27%) Ansible
2 27 (18.24%) Terraform
3 15 (10.14%) Kubernetes
4 8 (5.41%) QRadar
5 7 (4.73%) Red Hat Satellite
5 7 (4.73%) Tivoli
6 6 (4.05%) EMC NetWorker
6 6 (4.05%) Tivoli Storage Manager
7 5 (3.38%) Microsoft Intune
8 3 (2.03%) PowerCLI
8 3 (2.03%) Progress Chef
8 3 (2.03%) SCCM
8 3 (2.03%) vRealize
9 2 (1.35%) Control-M
9 2 (1.35%) Data Guard
9 2 (1.35%) Netcool
9 2 (1.35%) Prometheus
9 2 (1.35%) Puppet
9 2 (1.35%) ZABBIX
10 1 (0.68%) Nagios
Vendors
1 32 (21.62%) Oracle
2 23 (15.54%) VMware
3 22 (14.86%) Microsoft
4 14 (9.46%) Google
5 13 (8.78%) Red Hat
6 12 (8.11%) ServiceNow
7 11 (7.43%) Citrix
8 10 (6.76%) IBM
8 10 (6.76%) Qualys
8 10 (6.76%) Splunk
9 9 (6.08%) CyberArk
10 7 (4.73%) SaltStack
11 6 (4.05%) EMC
12 5 (3.38%) SAP
13 4 (2.70%) Cisco
13 4 (2.70%) Sybase
14 3 (2.03%) Commvault
14 3 (2.03%) IBM Sterling
14 3 (2.03%) SolarWinds
14 3 (2.03%) Zscaler