Data Engineer Job Trends in England

Data Engineer
UK > England

The median Data Engineer salary in England is £70,000 per year, according to job vacancies posted during the 6 months leading to 18 October 2025.

The table below compares current salary benchmarking and summary statistics with the previous two years.

6 months to
18 Oct 2025
Same period 2024 Same period 2023
Rank 221 180 139
Rank change year-on-year -41 -41 +15
Permanent jobs requiring a Data Engineer 602 930 1,207
As % of all permanent jobs in England 1.41% 1.49% 2.39%
As % of the Job Titles category 1.56% 1.57% 2.50%
Number of salaries quoted 461 750 988
10th Percentile £46,250 £40,000 £46,250
25th Percentile £57,500 £52,500 £55,000
Median annual salary (50th Percentile) £70,000 £70,000 £72,500
Median % change year-on-year - -3.45% +3.57%
75th Percentile £85,000 £92,373 £90,000
90th Percentile £97,500 £107,750 £106,250
UK median annual salary £70,000 £70,000 £70,000

All Permanent IT Job Vacancies
England

For comparison with the information above, the following table provides summary statistics for all permanent IT job vacancies in England. Most job vacancies include a discernible job title that can be normalized. As such, the figures in the second row provide an indication of the number of permanent jobs in our overall sample.

Permanent vacancies in England with a recognized job title 38,652 59,407 48,336
% of permanent jobs with a recognized job title 90.68% 95.19% 95.54%
Number of salaries quoted 23,299 34,065 37,318
10th Percentile £28,238 £31,250 £32,500
25th Percentile £35,750 £42,500 £44,250
Median annual salary (50th Percentile) £54,000 £57,500 £60,000
Median % change year-on-year -6.09% -4.17% -
75th Percentile £75,000 £75,000 £80,000
90th Percentile £95,000 £95,000 £100,000
UK median annual salary £52,500 £56,000 £60,000
% change year-on-year -6.25% -6.67% -

Data Engineer
Job Vacancy Trend in England

Historical trend showing the proportion of permanent IT job postings featuring 'Data Engineer' in the job title relative to all permanent IT jobs advertised in England.
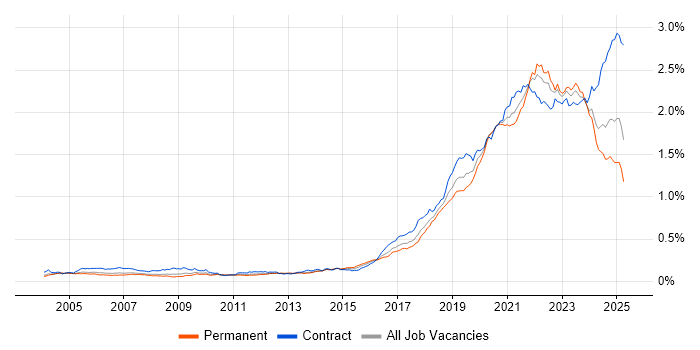
Data Engineer job vacancy trend in England

Data Engineer
Salary Trend in England

Salary distribution trend for Data Engineer job vacancies in England.

Salary distribution trend for Data Engineer job vacancies in England

Data Engineer
Salary Histogram in England

Salary distribution for jobs citing Data Engineer in England over the 6 months to 18 October 2025.

Salary histogram for Data Engineer in England

Data Engineer
Job Locations in England

The table below looks at the demand and provides a guide to the median salaries quoted in IT jobs citing Data Engineer within the England region over the 6 months to 18 October 2025. The 'Rank Change' column provides an indication of the change in demand within each location based on the same 6 month period last year.

Location Rank Change
on Same Period
Last Year
Matching
Permanent
IT Job Ads
Median Salary
Past 6 Months
Median Salary
% Change
on Same Period
Last Year
Live
Jobs
London +14 308 £80,000 - 201
North of England -55 110 £62,500 - 115
Midlands +32 84 £65,000 +16.59% 54
North West -42 58 £60,000 -4.00% 61
West Midlands +33 53 £60,000 +6.19% 37
Yorkshire +1 43 £67,500 +21.46% 39
South West +19 40 £72,500 +16.00% 25
South East -12 40 £60,000 +4.35% 177
East Midlands +19 31 £67,500 +35.00% 17
East of England -5 13 £82,500 +106.25% 22
North East -12 9 £67,500 -10.00% 16
Data Engineer
UK

Data Engineer Skill Set
Top 30 Co-Occurring Skills & Capabilities in England

For the 6 months to 18 October 2025, Data Engineer job roles required the following skills and capabilities in order of popularity. The figures indicate the absolute number of co-occurrences and as a proportion of all permanent job ads across the England region featuring Data Engineer in the job title.

1 417 (69.27%) Python
2 415 (68.94%) SQL
3 307 (51.00%) Data Engineering
4 304 (50.50%) Azure
5 278 (46.18%) Data Pipeline
6 275 (45.68%) ETL
7 220 (36.54%) Analytics
8 219 (36.38%) Data Modelling
9 210 (34.88%) Data Warehouse
10 199 (33.06%) AWS
11 167 (27.74%) Databricks
12 159 (26.41%) CI/CD
13 158 (26.25%) Business Intelligence
14 147 (24.42%) Power Platform
15 143 (23.75%) Power BI
16 141 (23.42%) Agile
17 128 (21.26%) DevOps
18 126 (20.93%) Problem-Solving
19 122 (20.27%) Mentoring
20 109 (18.11%) Azure Data Factory
21 106 (17.61%) Data Science
22 105 (17.44%) Microsoft
23 104 (17.28%) AI
24 95 (15.78%) Data Quality
25 94 (15.61%) SQL Server
26 93 (15.45%) Data Lake
26 93 (15.45%) Decision-Making
27 92 (15.28%) Data Governance
28 84 (13.95%) Machine Learning
28 84 (13.95%) PySpark

Data Engineer Skill Set
Co-Occurring Skills & Capabilities in England by Category

The following tables expand on the one above by listing co-occurrences grouped by category. They cover the same employment type, locality and period, with up to 20 co-occurrences shown in each category:

Application Platforms
1 71 (11.79%) Apache Spark
2 53 (8.80%) Apache Airflow
3 36 (5.98%) Apache
4 8 (1.33%) Confluence
5 6 (1.00%) SAS
6 4 (0.66%) Apache Pulsar
7 3 (0.50%) Luigi
8 2 (0.33%) GeoServer
9 1 (0.17%) Apache Superset
9 1 (0.17%) Appian
9 1 (0.17%) ArcGIS
9 1 (0.17%) IIS
9 1 (0.17%) Oracle Application Server
9 1 (0.17%) Oracle SOA Suite
9 1 (0.17%) Oracle Workflow
9 1 (0.17%) SharePoint
Applications
1 5 (0.83%) Microsoft Excel
1 5 (0.83%) Microsoft Office
2 2 (0.33%) Microsoft PowerPoint
2 2 (0.33%) Spreadsheet
Business Applications
1 2 (0.33%) Aladdin
2 1 (0.17%) Loan IQ
2 1 (0.17%) Oracle BPM
2 1 (0.17%) SAP ERP
Cloud Services
1 304 (50.50%) Azure
2 199 (33.06%) AWS
3 147 (24.42%) Power Platform
4 109 (18.11%) Azure Data Factory
5 81 (13.46%) Snowflake
6 74 (12.29%) GCP
7 66 (10.96%) Azure Synapse Analytics
8 58 (9.63%) Serverless
9 57 (9.47%) Amazon S3
10 51 (8.47%) Azure DevOps
11 48 (7.97%) dbt
12 46 (7.64%) AWS Lambda
13 28 (4.65%) SaaS
14 19 (3.16%) AWS Step Functions
14 19 (3.16%) GitHub
15 17 (2.82%) Amazon EC2
16 15 (2.49%) AWS CloudFormation
17 14 (2.33%) Amazon Kinesis
17 14 (2.33%) Amazon SageMaker
17 14 (2.33%) Microsoft Purview
Communications & Networking
1 27 (4.49%) Structured Cabling
2 26 (4.32%) Wi-Fi
3 3 (0.50%) PuTTY
4 2 (0.33%) Kerberos
5 1 (0.17%) DAB
5 1 (0.17%) Internet
Database & Business Intelligence
1 210 (34.88%) Data Warehouse
2 143 (23.75%) Power BI
3 94 (15.61%) SQL Server
4 93 (15.45%) Data Lake
5 54 (8.97%) Amazon Redshift
6 45 (7.48%) Big Data
7 36 (5.98%) Metadata
8 33 (5.48%) SQL Server Integration Services
9 32 (5.32%) Hadoop
9 32 (5.32%) NoSQL
10 29 (4.82%) Tableau
11 27 (4.49%) Delta Lake
11 27 (4.49%) Relational Database
12 24 (3.99%) Azure SQL Database
12 24 (3.99%) PostgreSQL
13 21 (3.49%) SQL Server Reporting Services
14 20 (3.32%) Amazon RDS
14 20 (3.32%) MySQL
15 19 (3.16%) Amazon Athena
16 18 (2.99%) MongoDB
Development Applications
1 28 (4.65%) Git
2 17 (2.82%) JIRA
3 14 (2.33%) Jenkins
4 4 (0.66%) Spinnaker
4 4 (0.66%) Terragrunt
5 3 (0.50%) GitLab
6 2 (0.33%) CircleCI
6 2 (0.33%) MLflow
6 2 (0.33%) Selenium
6 2 (0.33%) Visual Studio
7 1 (0.17%) Bitbucket
7 1 (0.17%) Deequ
7 1 (0.17%) SQL Server Management Studio (SSMS)
General
1 163 (27.08%) Finance
2 134 (22.26%) Social Skills
3 86 (14.29%) Analytical Skills
4 53 (8.80%) Retail
5 49 (8.14%) Law
6 43 (7.14%) Marketing
7 37 (6.15%) Legal
8 36 (5.98%) Inclusion and Diversity
9 31 (5.15%) Public Sector
10 19 (3.16%) Banking
11 15 (2.49%) Manufacturing
12 12 (1.99%) Influencing Skills
13 10 (1.66%) Financial Institution
13 10 (1.66%) Tech for Good
14 9 (1.50%) Front Office
15 7 (1.16%) Games
16 6 (1.00%) Electronics
16 6 (1.00%) Telecoms
17 5 (0.83%) Advertising
18 4 (0.66%) Automotive
Libraries, Frameworks & Software Standards
1 84 (13.95%) PySpark
2 52 (8.64%) Kafka
3 12 (1.99%) XML
4 11 (1.83%) JSON
5 9 (1.50%) Pandas
5 9 (1.50%) REST
6 8 (1.33%) .NET
6 8 (1.33%) AWS CDK
6 8 (1.33%) Spark Streaming
7 7 (1.16%) Apache NiFi
7 7 (1.16%) RabbitMQ
8 6 (1.00%) boto
8 6 (1.00%) Django
8 6 (1.00%) pytest
9 5 (0.83%) Middleware
9 5 (0.83%) React
10 4 (0.66%) ADO
10 4 (0.66%) Great Expectations
10 4 (0.66%) RESTful
10 4 (0.66%) TensorFlow
Miscellaneous
1 26 (4.32%) Data Structures
2 25 (4.15%) Cloud Native
2 25 (4.15%) Driving Licence
3 24 (3.99%) Onboarding
4 23 (3.82%) Legacy Systems
5 21 (3.49%) Distributed Systems
5 21 (3.49%) Greenfield Project
6 11 (1.83%) Product Ownership
7 9 (1.50%) e-Learning
8 8 (1.33%) Algorithms
9 7 (1.16%) Reference Data
10 5 (0.83%) Equities
10 5 (0.83%) IoT
10 5 (0.83%) Legacy Code
10 5 (0.83%) Low-Code
11 4 (0.66%) Analytical Mindset
11 4 (0.66%) Data Fabric
11 4 (0.66%) Distributed Computing
11 4 (0.66%) Hybrid Cloud
11 4 (0.66%) Mobile Banking
Operating Systems
1 9 (1.50%) Unix
2 4 (0.66%) Linux
Processes & Methodologies
1 307 (51.00%) Data Engineering
2 278 (46.18%) Data Pipeline
3 275 (45.68%) ETL
4 220 (36.54%) Analytics
5 219 (36.38%) Data Modelling
6 159 (26.41%) CI/CD
7 158 (26.25%) Business Intelligence
8 141 (23.42%) Agile
9 128 (21.26%) DevOps
10 126 (20.93%) Problem-Solving
11 122 (20.27%) Mentoring
12 106 (17.61%) Data Science
13 104 (17.28%) AI
14 93 (15.45%) Decision-Making
15 92 (15.28%) Data Governance
16 84 (13.95%) Machine Learning
17 71 (11.79%) Visualisation
18 66 (10.96%) Data Architecture
19 61 (10.13%) Migration
20 59 (9.80%) Software Engineering
Programming Languages
1 417 (69.27%) Python
2 415 (68.94%) SQL
3 62 (10.30%) Java
4 48 (7.97%) Scala
5 43 (7.14%) T-SQL
6 22 (3.65%) R
7 17 (2.82%) C#
8 16 (2.66%) Data Analysis Expressions
9 13 (2.16%) TypeScript
10 8 (1.33%) PL/SQL
11 7 (1.16%) C++
11 7 (1.16%) JavaScript
12 5 (0.83%) Bash
13 4 (0.66%) Bicep
13 4 (0.66%) Kotlin
13 4 (0.66%) PowerShell
14 3 (0.50%) Fortran
14 3 (0.50%) PROC SQL
15 2 (0.33%) Shell Script
15 2 (0.33%) VBA
Qualifications
1 66 (10.96%) Security Cleared
2 44 (7.31%) Degree
3 35 (5.81%) SC Cleared
4 16 (2.66%) AWS Certification
4 16 (2.66%) Azure Certification
4 16 (2.66%) Microsoft Certification
5 15 (2.49%) Computer Science Degree
6 11 (1.83%) SnowPro
7 9 (1.50%) CISSP
7 9 (1.50%) DV Cleared
7 9 (1.50%) MCSE
7 9 (1.50%) OCP
7 9 (1.50%) Oracle Certification
8 4 (0.66%) ISTQB
9 3 (0.50%) Master's Degree
10 1 (0.17%) BPSS Clearance
10 1 (0.17%) HNC
10 1 (0.17%) HND
10 1 (0.17%) PhD
10 1 (0.17%) Six Sigma Yellow Belt
Quality Assurance & Compliance
1 95 (15.78%) Data Quality
2 38 (6.31%) GDPR
3 18 (2.99%) QA
4 6 (1.00%) ISO/IEC 27001
5 4 (0.66%) Accessibility
5 4 (0.66%) NIST
6 2 (0.33%) GAAP
6 2 (0.33%) GRC
6 2 (0.33%) IFRS
6 2 (0.33%) IFRS 17
6 2 (0.33%) SLA
6 2 (0.33%) Solvency II
7 1 (0.17%) Cyber Essentials
7 1 (0.17%) Cyber Essentials PLUS
7 1 (0.17%) HIPAA
7 1 (0.17%) ISO 19650
System Software
1 48 (7.97%) Docker
2 10 (1.66%) HDFS
3 3 (0.50%) Active Directory
3 3 (0.50%) Apache Flume
Systems Management
1 61 (10.13%) Terraform
2 35 (5.81%) Kubernetes
3 9 (1.50%) Ansible
4 7 (1.16%) Grafana
5 5 (0.83%) Prometheus
6 4 (0.66%) Kibana
7 3 (0.50%) logstash
7 3 (0.50%) Oozie
7 3 (0.50%) Puppet
8 2 (0.33%) Progress Chef
9 1 (0.17%) Ambari
9 1 (0.17%) ZABBIX
Vendors
1 167 (27.74%) Databricks
2 105 (17.44%) Microsoft
3 32 (5.32%) Oracle
4 18 (2.99%) SAP
5 15 (2.49%) Palantir
6 14 (2.33%) Google
7 10 (1.66%) Foundry
7 10 (1.66%) Informatica
8 6 (1.00%) Talend
9 5 (0.83%) Dataiku
9 5 (0.83%) Splunk
10 3 (0.50%) Cloudera
10 3 (0.50%) Dell
10 3 (0.50%) MicroStrategy
11 2 (0.33%) Alteryx
11 2 (0.33%) Bloomberg
11 2 (0.33%) Facebook
11 2 (0.33%) IBM
11 2 (0.33%) Refinitiv
12 1 (0.17%) BiZZdesign