Full Stack Development Jobs in England

Full-Stack Development
UK > England

The following table provides summary statistics for permanent job vacancies advertised in England with a requirement for Full Stack Development skills. Included is a benchmarking guide to the salaries offered in vacancies that have cited Full Stack Development over the 6 months to 4 May 2024 with a comparison to the same period in the previous 2 years.

6 months to
4 May 2024
Same period 2023 Same period 2022
Rank 37 69 38
Rank change year-on-year +32 -31 -4
Permanent jobs citing Full Stack Development 4,263 4,137 10,157
As % of all permanent jobs advertised in England 5.00% 4.49% 7.67%
As % of the Processes & Methodologies category 5.83% 4.69% 8.02%
Number of salaries quoted 3,584 2,837 4,821
10th Percentile £40,000 £42,500 £38,750
25th Percentile £47,500 £52,500 £48,750
Median annual salary (50th Percentile) £60,000 £70,000 £65,000
Median % change year-on-year -14.29% +7.69% +18.18%
75th Percentile £78,750 £86,250 £86,250
90th Percentile £97,500 £112,500 £105,000
UK median annual salary £60,000 £67,500 £65,000
% change year-on-year -11.11% +3.85% +18.18%

All Process and Methodology Skills
England

Full Stack Development is in the Processes and Methodologies category. The following table is for comparison with the above and provides summary statistics for all permanent job vacancies advertised in England with a requirement for process or methodology skills.

Permanent vacancies with a requirement for process or methodology skills 73,078 88,196 126,702
As % of all permanent jobs advertised in England 85.76% 95.63% 95.67%
Number of salaries quoted 53,838 52,122 73,896
10th Percentile £29,000 £34,250 £33,500
25th Percentile £39,750 £45,910 £44,186
Median annual salary (50th Percentile) £55,000 £62,500 £60,000
Median % change year-on-year -12.00% +4.17% +9.09%
75th Percentile £73,650 £82,500 £80,000
90th Percentile £93,750 £101,185 £97,500
UK median annual salary £55,000 £61,500 £60,000
% change year-on-year -10.57% +2.50% +9.09%

Full Stack Development
Job Vacancy Trend in England

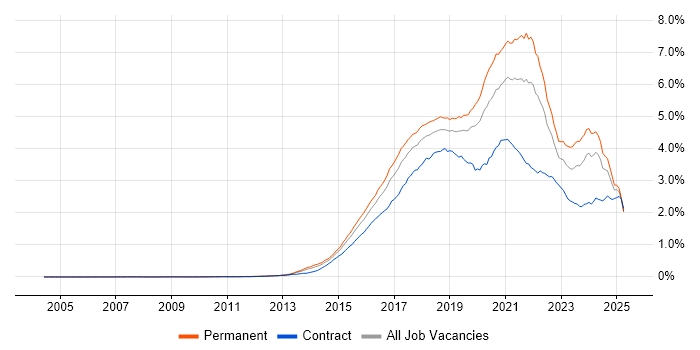
Job postings citing Full Stack Development as a proportion of all IT jobs advertised in England.

Job vacancy trend for Full Stack Development in England

Full Stack Development
Salary Trend in England

3-month moving average salary quoted in jobs citing Full Stack Development in England.

Salary trend for Full Stack Development in England

Full Stack Development
Salary Histogram in England

Salary distribution for jobs citing Full Stack Development in England over the 6 months to 4 May 2024.

Salary histogram for Full Stack Development in England

Full Stack Development
Job Locations in England

The table below looks at the demand and provides a guide to the median salaries quoted in IT jobs citing Full Stack Development within the England region over the 6 months to 4 May 2024. The 'Rank Change' column provides an indication of the change in demand within each location based on the same 6 month period last year.

Location Rank Change
on Same Period
Last Year
Matching
Permanent
IT Job Ads
Median Salary
Past 6 Months
Median Salary
% Change
on Same Period
Last Year
Live
Jobs
London +7 1,252 £82,500 +6.45% 366
North of England +54 863 £55,000 -4.35% 177
South East +18 792 £58,000 -3.33% 75
Midlands +73 551 £55,000 - 114
North West +44 514 £55,000 - 113
South West +35 481 £57,046 +3.72% 91
East of England +86 313 £60,000 +20.00% 48
East Midlands +32 275 £50,000 -9.09% 58
West Midlands +87 271 £55,000 +4.76% 55
Yorkshire +44 226 £55,000 -12.00% 47
North East +41 123 £60,000 +14.29% 18
Full Stack Development
UK

Full Stack Development
Co-occurring Skills and Capabilities in England by Category

The follow tables expand on the table above by listing co-occurrences grouped by category. The same employment type, locality and period is covered with up to 20 co-occurrences shown in each of the following categories:

Application Platforms
1 113 (2.65%) Apache
2 90 (2.11%) Apache Airflow
2 90 (2.11%) CMS
3 59 (1.38%) nginx
4 57 (1.34%) WordPress
5 36 (0.84%) Camunda
6 34 (0.80%) Umbraco
7 33 (0.77%) Drupal
8 26 (0.61%) SharePoint
9 23 (0.54%) Confluence
10 22 (0.52%) OpenStack
11 21 (0.49%) ArcGIS
11 21 (0.49%) IIS
12 18 (0.42%) Tomcat
13 10 (0.23%) Sitecore CMS
14 9 (0.21%) Microsoft Exchange
15 8 (0.19%) Apache Pig
16 7 (0.16%) Adobe Experience Manager
16 7 (0.16%) EPiServer
17 6 (0.14%) Immediacy CMS
Applications
1 20 (0.47%) Photoshop
2 15 (0.35%) Adobe XD
3 6 (0.14%) Simulink
4 3 (0.070%) MS Visio
4 3 (0.070%) Sketch
5 2 (0.047%) Chatbot
5 2 (0.047%) S-PLUS
6 1 (0.023%) Blender
6 1 (0.023%) Mathematica
6 1 (0.023%) Microsoft Excel
6 1 (0.023%) UXPin
6 1 (0.023%) Zeplin
Business Applications
1 33 (0.77%) Sparx Enterprise Architect
2 27 (0.63%) Payment Gateway
3 26 (0.61%) SDL Web 8
4 25 (0.59%) Shopify
5 23 (0.54%) Magento
6 14 (0.33%) SAP BPC
7 7 (0.16%) Maximo
8 5 (0.12%) NetSuite
9 3 (0.070%) Dynamics CRM
9 3 (0.070%) R3 Corda
10 2 (0.047%) Distributed Ledger
10 2 (0.047%) Dynamics NAV
10 2 (0.047%) Infor LN
10 2 (0.047%) nopCommerce
10 2 (0.047%) Sage 200
11 1 (0.023%) SAP Business One
Cloud Services
1 2,132 (50.01%) Azure
2 1,267 (29.72%) AWS
3 330 (7.74%) Serverless
4 317 (7.44%) Azure DevOps
5 279 (6.54%) GCP
6 275 (6.45%) IBM Cloud
7 185 (4.34%) SaaS
8 150 (3.52%) GitHub
9 135 (3.17%) Azure Functions
9 135 (3.17%) Azure Service Bus
10 129 (3.03%) Azure API Management
11 128 (3.00%) Azure Logic Apps
12 108 (2.53%) AWS Lambda
13 46 (1.08%) Microsoft 365
13 46 (1.08%) Power Platform
14 43 (1.01%) OpenShift
15 39 (0.91%) Google Play
16 37 (0.87%) Amazon ECS
17 35 (0.82%) GitHub Actions
18 32 (0.75%) Amazon EKS
Communications & Networking
1 168 (3.94%) Internet
2 29 (0.68%) HTTP
3 23 (0.54%) LAN
3 23 (0.54%) WAN
4 16 (0.38%) Hyperconnected
5 15 (0.35%) MQTT
6 7 (0.16%) Firewall
7 6 (0.14%) VPN
8 5 (0.12%) FTP
8 5 (0.12%) Reverse Proxy
8 5 (0.12%) TCP/IP
9 4 (0.094%) Intrusion Detection
9 4 (0.094%) OpenLDAP
9 4 (0.094%) SSH
10 3 (0.070%) HTTPS
10 3 (0.070%) Network Security
11 2 (0.047%) AMQP
11 2 (0.047%) DNS
11 2 (0.047%) Intranet
11 2 (0.047%) SSL
Database & Business Intelligence
1 1,091 (25.59%) SQL Server
2 594 (13.93%) MongoDB
3 520 (12.20%) PostgreSQL
4 388 (9.10%) NoSQL
5 295 (6.92%) MySQL
6 273 (6.40%) Relational Database
7 251 (5.89%) DB2
8 232 (5.44%) Elasticsearch
9 177 (4.15%) Azure SQL Database
10 90 (2.11%) Apache Ignite
11 65 (1.52%) Redis
12 59 (1.38%) DynamoDB
13 47 (1.10%) Oracle Database
14 45 (1.06%) Amazon RDS
15 42 (0.99%) GIS
16 32 (0.75%) SQL Server Integration Services
17 27 (0.63%) Data Warehouse
17 27 (0.63%) Power BI
17 27 (0.63%) SQL Server Reporting Services
18 23 (0.54%) Geospatial Data
Development Applications
1 416 (9.76%) Git
2 139 (3.26%) GitLab
3 127 (2.98%) JIRA
4 111 (2.60%) Jenkins
5 88 (2.06%) Visual Studio
6 70 (1.64%) Cypress.io
7 53 (1.24%) TeamCity
8 50 (1.17%) NUnit
9 32 (0.75%) Bitbucket
9 32 (0.75%) Moq
10 28 (0.66%) JUnit
11 27 (0.63%) Team Foundation Server
12 26 (0.61%) Maven
12 26 (0.61%) SonarQube
13 24 (0.56%) Cucumber
14 21 (0.49%) MSTest
14 21 (0.49%) Visual Studio Code
15 20 (0.47%) Selenium
16 19 (0.45%) Octopus Deploy
17 17 (0.40%) PHPUnit
General
1 628 (14.73%) Finance
2 477 (11.19%) Social Skills
3 392 (9.20%) Public Sector
4 210 (4.93%) Inclusion and Diversity
5 187 (4.39%) Banking
6 169 (3.96%) Front Office
7 167 (3.92%) Marketing
8 135 (3.17%) Retail
9 110 (2.58%) Games
10 98 (2.30%) Analytical Skills
11 97 (2.28%) Advertising
12 72 (1.69%) Tech for Good
13 57 (1.34%) Law
14 49 (1.15%) Health Technology
15 42 (0.99%) Legal
16 37 (0.87%) Music Industry
17 31 (0.73%) Aerospace
18 30 (0.70%) Organisational Skills
19 28 (0.66%) Manufacturing
20 27 (0.63%) Telecoms
Job Titles
1 3,308 (77.60%) Developer
2 1,466 (34.39%) Full Stack Developer
3 1,311 (30.75%) .NET Developer
4 688 (16.14%) Senior
5 539 (12.64%) C# Developer
6 514 (12.06%) Software Engineer
7 487 (11.42%) Full Stack Engineer
8 478 (11.21%) Senior Developer
9 418 (9.81%) C# .NET Developer
10 319 (7.48%) Lead
11 293 (6.87%) Software Developer
12 291 (6.83%) Senior Full Stack Developer
13 239 (5.61%) React Developer
14 198 (4.64%) Azure Developer
15 194 (4.55%) Full Stack .NET Developer
16 192 (4.50%) Lead Developer
17 171 (4.01%) Java Developer
18 170 (3.99%) Developer/Software Engineer
19 159 (3.73%) PHP Developer
20 154 (3.61%) Full-Stack C# Developer
Libraries, Frameworks & Software Standards
1 2,171 (50.93%) .NET
2 1,837 (43.09%) React
3 1,628 (38.19%) AngularJS
4 1,317 (30.89%) HTML
5 1,220 (28.62%) ASP.NET
6 1,144 (26.84%) CSS
7 961 (22.54%) .NET Core
8 947 (22.21%) Vue
9 912 (21.39%) Node.js
10 816 (19.14%) ASP.NET Web API
11 714 (16.75%) ASP.NET MVC
12 695 (16.30%) Entity Framework
13 637 (14.94%) .NET Framework
14 522 (12.24%) HTML5
15 518 (12.15%) RESTful
16 467 (10.95%) Twitter Bootstrap
17 434 (10.18%) REST
18 418 (9.81%) jQuery
19 403 (9.45%) Web Services
20 297 (6.97%) Blazor
Miscellaneous
1 292 (6.85%) Greenfield Project
2 286 (6.71%) Blockchain
3 282 (6.62%) Data Structures
4 275 (6.45%) Hybrid Cloud
5 271 (6.36%) Algorithms
6 153 (3.59%) e-Learning
7 150 (3.52%) Fixed Income
8 149 (3.50%) Hedge funds
9 129 (3.03%) Mobile App
10 101 (2.37%) Distributed Systems
11 82 (1.92%) Private Cloud
12 80 (1.88%) Equities
13 78 (1.83%) Cloud Native
13 78 (1.83%) Foreign Exchange (FX)
14 65 (1.52%) Product Ownership
15 58 (1.36%) Enterprise Software
16 55 (1.29%) Management Information System
17 48 (1.13%) Legacy Code
18 46 (1.08%) Derivative
19 42 (0.99%) Client/Server
Operating Systems
1 406 (9.52%) Linux
2 296 (6.94%) Android
3 289 (6.78%) Windows
4 255 (5.98%) Apple iOS
5 24 (0.56%) Unix
6 8 (0.19%) Ubuntu
6 8 (0.19%) Windows Server
7 5 (0.12%) Red Hat Enterprise Linux
7 5 (0.12%) Windows 10
8 4 (0.094%) AIX
9 1 (0.023%) Alpine Linux
9 1 (0.023%) Mac OS
9 1 (0.023%) Solaris
Processes & Methodologies
1 1,973 (46.28%) Agile
2 1,138 (26.69%) MVC
3 1,003 (23.53%) Microservices
4 866 (20.31%) Software Engineering
5 704 (16.51%) DevOps
6 684 (16.05%) TDD
7 539 (12.64%) Web Development
8 498 (11.68%) OO
8 498 (11.68%) User Experience
9 492 (11.54%) Artificial Intelligence
10 491 (11.52%) Problem-Solving
11 433 (10.16%) Scrum
12 418 (9.81%) BDD
13 417 (9.78%) Mentoring
14 410 (9.62%) Design Patterns
15 400 (9.38%) CI/CD
16 377 (8.84%) OOP
17 351 (8.23%) SOLID
18 316 (7.41%) Kanban
19 297 (6.97%) Code Quality
Programming Languages
1 2,524 (59.21%) JavaScript
2 2,069 (48.53%) C#
3 1,195 (28.03%) TypeScript
4 1,144 (26.84%) SQL
5 726 (17.03%) Python
6 702 (16.47%) Java
7 437 (10.25%) PHP
8 115 (2.70%) T-SQL
9 67 (1.57%) Go
10 65 (1.52%) Ruby
11 46 (1.08%) Kotlin
12 41 (0.96%) Rust
13 39 (0.91%) VB
14 37 (0.87%) C++
15 36 (0.84%) Lua
16 28 (0.66%) JSX
16 28 (0.66%) PowerShell
17 24 (0.56%) Clojure
17 24 (0.56%) F#
18 22 (0.52%) VB.NET
Qualifications
1 377 (8.84%) Degree
2 242 (5.68%) Security Cleared
3 146 (3.42%) SC Cleared
4 133 (3.12%) Computer Science Degree
5 42 (0.99%) BPSS Clearance
6 39 (0.91%) DBS Check
7 36 (0.84%) Master's Degree
8 33 (0.77%) DV Cleared
8 33 (0.77%) TOGAF Certification
9 27 (0.63%) Azure Certification
10 25 (0.59%) AWS Certification
11 9 (0.21%) PhD
12 7 (0.16%) Microsoft Certification
12 7 (0.16%) Postgraduate
13 6 (0.14%) HND
14 3 (0.070%) MBA
15 1 (0.023%) AWS Certified Developer
15 1 (0.023%) AWS Certified Solutions Architect
15 1 (0.023%) BC Cleared
15 1 (0.023%) PMI Certification
Quality Assurance & Compliance
1 160 (3.75%) QA
2 42 (0.99%) Accessibility
3 16 (0.38%) GDPR
4 5 (0.12%) HIPAA
5 4 (0.094%) Data Quality
5 4 (0.094%) ISO 13485
5 4 (0.094%) SLA
6 3 (0.070%) California Consumer Privacy Act
6 3 (0.070%) ISO/IEC 27001
6 3 (0.070%) MiFID
6 3 (0.070%) PMO
6 3 (0.070%) WCAG
7 2 (0.047%) HL7
7 2 (0.047%) IEC 62304
7 2 (0.047%) PCI DSS
7 2 (0.047%) WAI
8 1 (0.023%) ISO 9001
System Software
1 427 (10.02%) Docker
2 11 (0.26%) Hyper-V
3 10 (0.23%) Active Directory
4 8 (0.19%) HDFS
4 8 (0.19%) VMware ESXi
5 6 (0.14%) Firmware
5 6 (0.14%) VMware Infrastructure
6 2 (0.047%) Embedded Firmware
7 1 (0.023%) Varnish
Systems Management
1 273 (6.40%) Kubernetes
2 108 (2.53%) Terraform
3 41 (0.96%) Ansible
4 9 (0.21%) Grafana
5 8 (0.19%) Kibana
5 8 (0.19%) Puppet
6 6 (0.14%) Kiali
7 5 (0.12%) Control-M
8 4 (0.094%) Rancher
8 4 (0.094%) Single Sign-On
8 4 (0.094%) vCenter Server
9 3 (0.070%) logstash
9 3 (0.070%) Progress Chef
10 2 (0.047%) Core Impact
11 1 (0.023%) Consul
11 1 (0.023%) Hadoop YARN
11 1 (0.023%) Microsoft Intune
11 1 (0.023%) MIIS
11 1 (0.023%) Packer
11 1 (0.023%) Prometheus
Vendors
1 937 (21.98%) Microsoft
2 293 (6.87%) IBM
3 279 (6.54%) Red Hat
4 249 (5.84%) Google
5 90 (2.11%) Facebook
6 85 (1.99%) Oracle
7 43 (1.01%) Adobe
8 33 (0.77%) Apple
8 33 (0.77%) Sparx
9 28 (0.66%) Sony
9 28 (0.66%) YouTube
10 27 (0.63%) Yahoo!
11 26 (0.61%) Sitecore
12 23 (0.54%) SAP
13 22 (0.52%) OpenAI
14 21 (0.49%) Xamarin
15 16 (0.38%) WSO2
16 14 (0.33%) Atlassian
16 14 (0.33%) Cognizant
16 14 (0.33%) VMware