Containerisation Jobs in England

Containerization
UK > England

The table below provides summary statistics for permanent job vacancies advertised in England requiring Containerisation skills. It includes a benchmarking guide to the annual salaries offered in vacancies that cited Containerisation over the 6 months leading up to 30 May 2025, comparing them to the same period in the previous two years.

6 months to
30 May 2025
Same period 2024 Same period 2023
Rank 110 191 120
Rank change year-on-year +81 -71 +15
Permanent jobs citing Containerisation 1,395 1,335 2,516
As % of all permanent jobs advertised in England 2.85% 1.49% 2.91%
As % of the Processes & Methodologies category 3.03% 1.78% 3.05%
Number of salaries quoted 656 992 1,234
10th Percentile £51,250 £46,250 £46,250
25th Percentile £60,000 £55,000 £56,219
Median annual salary (50th Percentile) £75,000 £72,500 £71,750
Median % change year-on-year +3.45% +1.05% +2.50%
75th Percentile £97,500 £88,750 £92,500
90th Percentile £127,500 £105,000 £105,000
UK median annual salary £75,000 £70,000 £70,000
% change year-on-year +7.14% - -

All Process and Methodology Skills
England

Containerisation falls under the Processes and Methodologies category. For comparison with the information above, the following table provides summary statistics for all permanent job vacancies requiring process or methodology skills in England.

Permanent vacancies with a requirement for process or methodology skills 46,039 75,199 82,570
As % of all permanent jobs advertised in England 94.03% 84.05% 95.58%
Number of salaries quoted 22,875 54,702 49,146
10th Percentile £29,500 £29,000 £34,452
25th Percentile £41,250 £40,000 £46,000
Median annual salary (50th Percentile) £57,500 £55,000 £62,500
Median % change year-on-year +4.55% -12.00% +4.17%
75th Percentile £75,000 £72,500 £82,500
90th Percentile £97,528 £93,750 £102,500
UK median annual salary £57,443 £55,000 £60,899
% change year-on-year +4.44% -9.69% +1.50%

Containerisation
Job Vacancy Trend in England

Job postings citing Containerisation as a proportion of all IT jobs advertised in England.
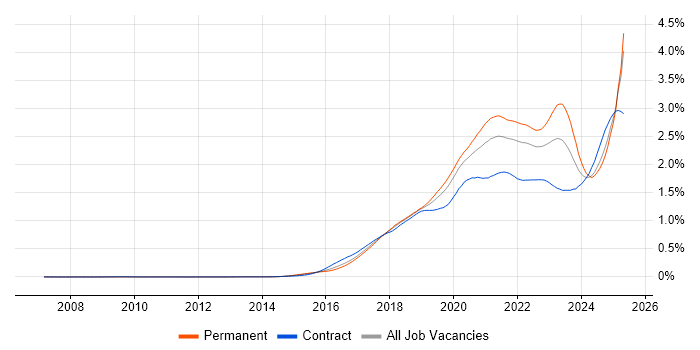
Job vacancy trend for Containerisation in England

Containerisation
Salary Trend in England

3-month moving average salary quoted in jobs citing Containerisation in England.

Salary trend for Containerisation in England

Containerisation
Salary Histogram in England

Salary distribution for jobs citing Containerisation in England over the 6 months to 30 May 2025.

Salary histogram for Containerisation in England

Containerisation
Job Locations in England

The table below looks at the demand and provides a guide to the median salaries quoted in IT jobs citing Containerisation within the England region over the 6 months to 30 May 2025. The 'Rank Change' column provides an indication of the change in demand within each location based on the same 6 month period last year.

Location Rank Change
on Same Period
Last Year
Matching
Permanent
IT Job Ads
Median Salary
Past 6 Months
Median Salary
% Change
on Same Period
Last Year
Live
Jobs
London +88 529 £90,000 +7.14% 587
North of England +37 284 £65,000 +8.33% 1,026
North West +40 204 £58,500 -8.95% 480
South East +52 183 £65,000 -7.14% 1,372
Midlands +86 134 £61,250 +2.08% 881
South West +39 86 £72,246 -0.35% 573
West Midlands +50 72 £65,000 +8.33% 472
East of England +47 71 £67,500 +3.85% 694
Yorkshire +13 66 £70,000 +16.67% 431
East Midlands +63 62 £60,000 - 350
North East +47 14 £66,019 +14.81% 117
Containerisation
UK

Containerisation
Co-occurring Skills and Capabilities in England by Category

The follow tables expand on the table above by listing co-occurrences grouped by category. The same employment type, locality and period is covered with up to 20 co-occurrences shown in each of the following categories:

Application Platforms
1 133 (9.53%) Confluence
2 24 (1.72%) Apache Spark
3 22 (1.58%) Apache Airflow
4 13 (0.93%) Apache
5 4 (0.29%) CMS
5 4 (0.29%) IIS
5 4 (0.29%) SAS
5 4 (0.29%) SharePoint
6 3 (0.22%) Apache Solr
6 3 (0.22%) Microsoft Exchange
6 3 (0.22%) nginx
6 3 (0.22%) OpenStack
6 3 (0.22%) Oracle SOA Suite
7 2 (0.14%) Ethereum
8 1 (0.072%) Camunda
8 1 (0.072%) GemFire
8 1 (0.072%) Mendix
8 1 (0.072%) NServiceBus
8 1 (0.072%) Tomcat
Applications
1 9 (0.65%) Maya
2 5 (0.36%) Chatbot
3 2 (0.14%) Adobe XD
3 2 (0.14%) EngageOne
3 2 (0.14%) MS Visio
3 2 (0.14%) Sketch
Business Applications
1 1 (0.072%) Endur
1 1 (0.072%) Oracle Payables
1 1 (0.072%) Payment Gateway
Cloud Services
1 916 (65.66%) AWS
2 694 (49.75%) Azure
3 332 (23.80%) GCP
4 228 (16.34%) Pulumi
5 119 (8.53%) AWS CloudFormation
6 114 (8.17%) Serverless
7 96 (6.88%) Azure DevOps
8 84 (6.02%) Amazon EKS
9 81 (5.81%) GitHub
10 80 (5.73%) Amazon EC2
11 74 (5.30%) Amazon S3
12 73 (5.23%) AWS Lambda
13 59 (4.23%) SaaS
14 55 (3.94%) GitHub Actions
15 54 (3.87%) Cloud Computing
16 34 (2.44%) Amazon CloudWatch
17 27 (1.94%) PaaS
18 24 (1.72%) AWS KMS
18 24 (1.72%) Azure Monitor
19 21 (1.51%) Amazon SQS
Communications & Networking
1 215 (15.41%) Broadband
2 27 (1.94%) Wireshark
3 24 (1.72%) Network Security
4 19 (1.36%) Firewall
5 18 (1.29%) HTTP
6 17 (1.22%) TCP/IP
7 13 (0.93%) SAN
8 11 (0.79%) Internet
9 10 (0.72%) DNS
10 7 (0.50%) VLAN
11 6 (0.43%) DHCP
11 6 (0.43%) NAS
11 6 (0.43%) VPN
12 5 (0.36%) Multicast
13 4 (0.29%) BGP
13 4 (0.29%) EIGRP
13 4 (0.29%) OSPF
14 3 (0.22%) Fibre Channel
14 3 (0.22%) LAN
14 3 (0.22%) WAN
Database & Business Intelligence
1 342 (24.52%) NoSQL
2 268 (19.21%) SQL Server
3 253 (18.14%) Relational Database
4 225 (16.13%) RDBMS
5 126 (9.03%) PostgreSQL
6 67 (4.80%) MongoDB
7 63 (4.52%) Elasticsearch
8 52 (3.73%) Amazon RDS
9 40 (2.87%) MySQL
10 39 (2.80%) DynamoDB
11 28 (2.01%) Data Warehouse
12 23 (1.65%) Big Data
13 21 (1.51%) Data Lake
14 17 (1.22%) Azure SQL Database
15 16 (1.15%) BigQuery
16 15 (1.08%) Amazon Aurora
17 13 (0.93%) Tableau
18 11 (0.79%) Amazon Athena
18 11 (0.79%) Redis
19 10 (0.72%) Tick Data
Development Applications
1 302 (21.65%) GitLab
2 244 (17.49%) JIRA
2 244 (17.49%) SonarQube
3 229 (16.42%) Sonatype Nexus
4 219 (15.70%) Cucumber
5 216 (15.48%) Maven
6 215 (15.41%) Jaeger
7 206 (14.77%) Selenium
8 204 (14.62%) Bitbucket
9 128 (9.18%) Git
10 105 (7.53%) Jenkins
11 36 (2.58%) IntelliJ
11 36 (2.58%) JUnit
12 29 (2.08%) Mockito
13 28 (2.01%) CircleCI
14 22 (1.58%) webpack
15 21 (1.51%) Jasmine
16 15 (1.08%) Cypress.io
16 15 (1.08%) Karma Test Runner
16 15 (1.08%) TeamCity
General
1 550 (39.43%) Inclusion and Diversity
2 474 (33.98%) Finance
3 339 (24.30%) Banking
4 279 (20.00%) Social Skills
5 112 (8.03%) Retail
6 100 (7.17%) Investment Banking
7 99 (7.10%) Analytical Skills
8 90 (6.45%) Corporate Banking
9 79 (5.66%) Public Sector
10 47 (3.37%) Law
11 46 (3.30%) Marketing
12 27 (1.94%) Manufacturing
13 22 (1.58%) Games
14 17 (1.22%) Electronics
14 17 (1.22%) Financial Institution
15 16 (1.15%) Front Office
15 16 (1.15%) Telecoms
16 13 (0.93%) Pharmaceutical
17 7 (0.50%) Legal
17 7 (0.50%) Organisational Skills
Job Titles
1 387 (27.74%) Lead
2 314 (22.51%) Software Engineer
3 239 (17.13%) Team Leader
4 233 (16.70%) Developer
5 170 (12.19%) Senior
6 147 (10.54%) DevOps Engineer
7 107 (7.67%) Architect
8 67 (4.80%) Java Engineer
9 64 (4.59%) Software Developer
10 59 (4.23%) Solutions Architect
11 50 (3.58%) Platform Engineer
12 46 (3.30%) Azure Engineer
12 46 (3.30%) Python Engineer
13 43 (3.08%) Senior Developer
14 42 (3.01%) Cloud Engineer
14 42 (3.01%) Systems Engineer
15 39 (2.80%) AWS Engineer
15 39 (2.80%) Java Developer
15 39 (2.80%) Python Developer
16 37 (2.65%) Data Engineer
Libraries, Frameworks & Software Standards
1 368 (26.38%) React
2 293 (21.00%) Kafka
3 291 (20.86%) Spring
4 284 (20.36%) Spring Boot
5 252 (18.06%) Elastic Stack
6 231 (16.56%) CSS
7 230 (16.49%) JPA
8 227 (16.27%) HTML
9 219 (15.70%) OpenTelemetry
10 212 (15.20%) Redux
11 211 (15.13%) RESTful
12 209 (14.98%) REST
13 141 (10.11%) Hibernate
14 136 (9.75%) .NET
15 118 (8.46%) Jest
16 103 (7.38%) HTML5
17 101 (7.24%) AngularJS
17 101 (7.24%) CSS3
18 98 (7.03%) Sass
19 95 (6.81%) Node.js
Miscellaneous
1 248 (17.78%) Product Ownership
2 212 (15.20%) Enterprise Software
3 119 (8.53%) Cloud Native
4 64 (4.59%) Distributed Systems
5 62 (4.44%) Management Information System
6 49 (3.51%) Cyberattack
6 49 (3.51%) Hybrid Cloud
7 37 (2.65%) e-Learning
8 31 (2.22%) Algorithms
9 27 (1.94%) Public Cloud
10 22 (1.58%) Legacy Systems
11 20 (1.43%) Blockchain
12 16 (1.15%) Private Cloud
13 14 (1.00%) Onboarding
13 14 (1.00%) Reinsurance
14 13 (0.93%) Greenfield Project
14 13 (0.93%) IoT
15 12 (0.86%) Data Structures
16 11 (0.79%) Distributed Applications
17 9 (0.65%) Distributed Computing
Operating Systems
1 428 (30.68%) Linux
2 224 (16.06%) Unix
3 76 (5.45%) Windows
4 57 (4.09%) Android
5 24 (1.72%) Red Hat Enterprise Linux
6 22 (1.58%) Windows Server
7 14 (1.00%) CentOS
8 10 (0.72%) Ubuntu
9 6 (0.43%) Apple iOS
10 5 (0.36%) Debian
10 5 (0.36%) SUSE
10 5 (0.36%) SUSE Linux Enterprise Server
10 5 (0.36%) Windows 10
10 5 (0.36%) Windows Server 2012
10 5 (0.36%) Windows Server 2016
10 5 (0.36%) Windows Server 2019
11 3 (0.22%) Mac OS
12 1 (0.072%) Solaris
12 1 (0.072%) VMS
Processes & Methodologies
1 913 (65.45%) DevOps
2 888 (63.66%) Agile
3 760 (54.48%) CI/CD
4 539 (38.64%) Microservices
5 483 (34.62%) Mentoring
6 481 (34.48%) Software Engineering
7 457 (32.76%) Infrastructure as Code
7 457 (32.76%) Performance Optimisation
8 377 (27.03%) Test Automation
9 340 (24.37%) Roadmaps
10 304 (21.79%) Continuous Integration
11 283 (20.29%) High Availability
12 264 (18.92%) Full-Stack Development
13 257 (18.42%) SDLC
14 251 (17.99%) Product Management
15 247 (17.71%) Front End Development
16 246 (17.63%) Cost Optimisation
17 231 (16.56%) Resource Management
18 225 (16.13%) GitOps
18 225 (16.13%) Problem-Solving
Programming Languages
1 771 (55.27%) Java
2 627 (44.95%) Python
3 565 (40.50%) JavaScript
4 375 (26.88%) SQL
5 318 (22.80%) Go
6 305 (21.86%) Bash
7 173 (12.40%) TypeScript
8 122 (8.75%) C#
9 79 (5.66%) Rust
10 73 (5.23%) PowerShell
11 63 (4.52%) C++
12 23 (1.65%) Scala
13 15 (1.08%) C
14 14 (1.00%) Bicep
15 9 (0.65%) PHP
16 8 (0.57%) Shell Script
17 7 (0.50%) Ruby
18 6 (0.43%) R
19 5 (0.36%) Kusto Query Language
20 4 (0.29%) Kotlin
Qualifications
1 283 (20.29%) AWS Certification
2 196 (14.05%) Degree
3 145 (10.39%) Security Cleared
4 78 (5.59%) DV Cleared
5 67 (4.80%) Computer Science Degree
6 57 (4.09%) SC Cleared
7 56 (4.01%) Master's Degree
8 50 (3.58%) AWS Certified Solutions Architect
9 48 (3.44%) Azure Certification
10 35 (2.51%) BPSS Clearance
11 31 (2.22%) PhD
12 23 (1.65%) Chartered Engineer
13 16 (1.15%) TOGAF Certification
14 15 (1.08%) HND
15 6 (0.43%) Microsoft Certification
16 4 (0.29%) CISSP
16 4 (0.29%) VMware Certified Professional (VCP)
17 3 (0.22%) ISTQB
17 3 (0.22%) Linux+ Certification
17 3 (0.22%) RHCE
Quality Assurance & Compliance
1 252 (18.06%) QA
2 98 (7.03%) Accessibility
3 54 (3.87%) GDPR
4 42 (3.01%) HIPAA
5 18 (1.29%) ISO/IEC 27001
5 18 (1.29%) SOC 2
6 16 (1.15%) NIST
7 9 (0.65%) PCI DSS
8 8 (0.57%) NCSC
9 6 (0.43%) CDISC
10 5 (0.36%) Data Quality
11 4 (0.29%) Basel II
11 4 (0.29%) Basel III
11 4 (0.29%) Dodd-Frank
11 4 (0.29%) GMP
11 4 (0.29%) IFRS
11 4 (0.29%) IFRS 9
11 4 (0.29%) Sarbanes-Oxley
11 4 (0.29%) SLA
12 2 (0.14%) Cyber Essentials
System Software
1 1,048 (75.13%) Docker
2 41 (2.94%) Virtual Machines
3 38 (2.72%) VMware Infrastructure
4 17 (1.22%) Active Directory
5 14 (1.00%) Hyper-V
6 12 (0.86%) vSphere
7 11 (0.79%) VMware ESXi
8 9 (0.65%) NFS
9 6 (0.43%) Postfix
10 5 (0.36%) Apache Flume
11 4 (0.29%) VMware NSX
12 3 (0.22%) Dovecot
13 1 (0.072%) KVM
13 1 (0.072%) LXC
13 1 (0.072%) Samba
13 1 (0.072%) Slurm Workload Manager
13 1 (0.072%) vCloud
Systems Management
1 1,026 (73.55%) Kubernetes
2 538 (38.57%) Terraform
3 395 (28.32%) Ansible
4 299 (21.43%) Prometheus
5 225 (16.13%) Argo
6 215 (15.41%) Kustomize
7 83 (5.95%) Grafana
8 17 (1.22%) Progress Chef
9 12 (0.86%) Istio
10 8 (0.57%) Puppet
11 5 (0.36%) Oozie
11 5 (0.36%) SCCM
12 4 (0.29%) Consul
12 4 (0.29%) Nagios
13 3 (0.22%) Docker Swarm
13 3 (0.22%) Kibana
13 3 (0.22%) Packer
13 3 (0.22%) Rancher
13 3 (0.22%) Single Sign-On
14 2 (0.14%) logstash
Vendors
1 305 (21.86%) Google
2 198 (14.19%) Solace
3 110 (7.89%) Microsoft
4 67 (4.80%) IBM
5 55 (3.94%) Red Hat
6 44 (3.15%) VMware
7 29 (2.08%) Databricks
8 27 (1.94%) SAP
9 20 (1.43%) Splunk
10 17 (1.22%) Cisco
11 16 (1.15%) Oracle
12 14 (1.00%) Atlassian
13 9 (0.65%) Hitachi
14 8 (0.57%) New Relic
15 7 (0.50%) Confluent
15 7 (0.50%) Pure Storage
16 6 (0.43%) Apple
16 6 (0.43%) Commvault
16 6 (0.43%) Ping Identity
17 5 (0.36%) Cloudera