HTML5 Jobs in England

HTML5
UK > England

The table below provides summary statistics for permanent job vacancies advertised in England requiring HTML5 skills. It includes a benchmarking guide to the annual salaries offered in vacancies that cited HTML5 over the 6 months leading up to 24 June 2025, comparing them to the same period in the previous two years.

6 months to
24 Jun 2025
Same period 2024 Same period 2023
Rank 393 252 312
Rank change year-on-year -141 +60 -169
Permanent jobs citing HTML5 314 1,018 891
As % of all permanent jobs advertised in England 0.63% 1.06% 1.11%
As % of the Libraries, Frameworks & Software Standards category 3.58% 5.45% 3.82%
Number of salaries quoted 185 913 612
10th Percentile £31,250 £36,250 £36,750
25th Percentile £42,500 £43,750 £45,000
Median annual salary (50th Percentile) £60,000 £55,000 £60,000
Median % change year-on-year +9.09% -8.33% -
75th Percentile £77,500 £70,000 £88,283
90th Percentile £100,000 £81,250 £108,750
UK median annual salary £60,000 £55,000 £60,000
% change year-on-year +9.09% -8.33% -

All Software Libraries and Frameworks
England

HTML5 falls under the Software Libraries and Frameworks category. For comparison with the information above, the following table provides summary statistics for all permanent job vacancies requiring technical specification, industry standards, software libraries and framework skills in England.

Permanent vacancies with a requirement for technical specification, industry standards, software libraries and framework skills 8,776 18,679 23,336
As % of all permanent jobs advertised in England 17.67% 19.44% 28.98%
Number of salaries quoted 5,379 14,732 15,454
10th Percentile £38,750 £36,250 £41,250
25th Percentile £51,250 £45,000 £51,250
Median annual salary (50th Percentile) £67,500 £60,000 £67,500
Median % change year-on-year +12.50% -11.11% +3.85%
75th Percentile £87,500 £80,000 £87,500
90th Percentile £115,000 £100,000 £108,750
UK median annual salary £66,434 £60,000 £67,500
% change year-on-year +10.72% -11.11% +3.85%

HTML5
Job Vacancy Trend in England

Job postings citing HTML5 as a proportion of all IT jobs advertised in England.
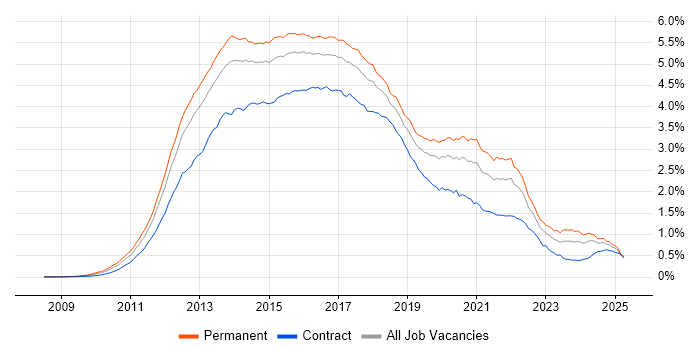
Job vacancy trend for HTML5 in England

HTML5
Salary Trend in England

3-month moving average salary quoted in jobs citing HTML5 in England.

Salary trend for HTML5 in England

HTML5
Salary Histogram in England

Salary distribution for jobs citing HTML5 in England over the 6 months to 24 June 2025.

Salary histogram for HTML5 in England

HTML5
Job Locations in England

The table below looks at the demand and provides a guide to the median salaries quoted in IT jobs citing HTML5 within the England region over the 6 months to 24 June 2025. The 'Rank Change' column provides an indication of the change in demand within each location based on the same 6 month period last year.

Location Rank Change
on Same Period
Last Year
Matching
Permanent
IT Job Ads
Median Salary
Past 6 Months
Median Salary
% Change
on Same Period
Last Year
Live
Jobs
North of England -21 116 £42,500 -10.53% 70
North West -32 102 £42,500 -10.53% 45
London +36 97 £68,750 -1.79% 304
South East -118 35 £65,000 +13.04% 77
Midlands -15 27 £53,750 +7.50% 31
South West +59 19 £49,500 -10.00% 33
West Midlands +27 19 £55,000 +22.22% 19
East of England -50 19 £42,500 -29.17% 31
Yorkshire +24 11 £43,750 -10.26% 19
East Midlands +1 8 £52,500 +5.00% 12
North East +31 3 £28,500 -43.00% 6
HTML5
UK

HTML5
Co-occurring Skills and Capabilities in England by Category

The follow tables expand on the table above by listing co-occurrences grouped by category. The same employment type, locality and period is covered with up to 20 co-occurrences shown in each of the following categories:

Application Platforms
1 34 (10.83%) CMS
2 16 (5.10%) IIS
2 16 (5.10%) WordPress
3 15 (4.78%) Umbraco
4 7 (2.23%) Confluence
5 5 (1.59%) Apache
5 5 (1.59%) Drupal
5 5 (1.59%) Headless CMS
6 1 (0.32%) Apache Airflow
6 1 (0.32%) nginx
6 1 (0.32%) OpenEdge
Applications
1 9 (2.87%) Photoshop
2 5 (1.59%) Adobe Premiere
3 4 (1.27%) Microsoft Office
4 3 (0.96%) Adobe Illustrator
4 3 (0.96%) Elementor
5 2 (0.64%) Adobe After Effects
5 2 (0.64%) Adobe XD
5 2 (0.64%) Chatbot
6 1 (0.32%) Adobe Creative Suite
6 1 (0.32%) CINEMA 4D
6 1 (0.32%) InDesign
6 1 (0.32%) Zeplin
Business Applications
1 2 (0.64%) Dynamics CRM
2 1 (0.32%) Magento
2 1 (0.32%) Shopify
Cloud Services
1 157 (50.00%) Azure
2 144 (45.86%) AWS
3 18 (5.73%) GitHub
3 18 (5.73%) Serverless
4 13 (4.14%) Cloudflare
5 11 (3.50%) Figma
5 11 (3.50%) GCP
6 10 (3.18%) Azure DevOps
6 10 (3.18%) SaaS
7 9 (2.87%) AWS Lambda
8 5 (1.59%) Amazon Cognito
8 5 (1.59%) Amazon S3
8 5 (1.59%) Amazon SQS
8 5 (1.59%) Cloud Computing
8 5 (1.59%) CloudFront
8 5 (1.59%) Contentful
8 5 (1.59%) Vercel
9 4 (1.27%) Amazon EC2
9 4 (1.27%) dbt
10 3 (0.96%) Azure Logic Apps
Communications & Networking
1 14 (4.46%) Intranet
2 5 (1.59%) HTTP
3 3 (0.96%) Internet
4 2 (0.64%) DNS
4 2 (0.64%) TCP/IP
4 2 (0.64%) Wi-Fi
4 2 (0.64%) Wireless
4 2 (0.64%) Wireshark
5 1 (0.32%) Broadband
5 1 (0.32%) FTP
5 1 (0.32%) SMTP
5 1 (0.32%) SSL
5 1 (0.32%) WPA
Database & Business Intelligence
1 149 (47.45%) SQL Server
2 34 (10.83%) MySQL
3 33 (10.51%) MongoDB
4 21 (6.69%) Azure SQL Database
5 20 (6.37%) PostgreSQL
6 18 (5.73%) NoSQL
7 16 (5.10%) Elasticsearch
8 10 (3.18%) Redis
9 9 (2.87%) Relational Database
10 8 (2.55%) NonStop SQL
11 6 (1.91%) Big Data
12 4 (1.27%) Amazon Athena
12 4 (1.27%) Amazon RDS
12 4 (1.27%) Apache Iceberg
12 4 (1.27%) Data Warehouse
12 4 (1.27%) DynamoDB
13 3 (0.96%) Oracle Database
14 2 (0.64%) Amazon Aurora
14 2 (0.64%) SQL Server Integration Services
14 2 (0.64%) SQL Server Reporting Services
Development Applications
1 109 (34.71%) JIRA
2 97 (30.89%) GitLab
2 97 (30.89%) Selenium
3 95 (30.25%) Bitbucket
4 94 (29.94%) SonarQube
5 93 (29.62%) Maven
6 91 (28.98%) Cucumber
7 90 (28.66%) Sonatype Nexus
8 82 (26.11%) Git
9 21 (6.69%) Jasmine
10 17 (5.41%) TeamCity
11 14 (4.46%) NUnit
12 13 (4.14%) Jenkins
12 13 (4.14%) webpack
13 11 (3.50%) Subversion
14 8 (2.55%) Karma Test Runner
14 8 (2.55%) Postman
14 8 (2.55%) Vite
15 5 (1.59%) Browser DevTools
15 5 (1.59%) Storybook
General
1 147 (46.82%) Finance
2 106 (33.76%) Banking
3 101 (32.17%) Inclusion and Diversity
4 100 (31.85%) Investment Banking
5 97 (30.89%) Retail
6 90 (28.66%) Corporate Banking
7 78 (24.84%) Social Skills
8 19 (6.05%) Games
9 18 (5.73%) Marketing
10 13 (4.14%) Analytical Skills
10 13 (4.14%) Law
11 8 (2.55%) Advertising
12 5 (1.59%) Front Office
13 4 (1.27%) Automotive
14 3 (0.96%) Legal
15 2 (0.64%) Back Office
15 2 (0.64%) Electronics
15 2 (0.64%) Manufacturing
15 2 (0.64%) Public Sector
15 2 (0.64%) Telecoms
Job Titles
1 186 (59.24%) Developer
2 101 (32.17%) Software Engineer
3 42 (13.38%) Full-Stack Developer
4 40 (12.74%) .NET Developer
4 40 (12.74%) Senior
5 36 (11.46%) Senior Developer
6 30 (9.55%) Front-End Developer (Client-Side Developer)
7 23 (7.32%) React Developer
8 17 (5.41%) JavaScript Developer
9 16 (5.10%) C# Developer
9 16 (5.10%) Software Developer
10 14 (4.46%) PHP Developer
10 14 (4.46%) Umbraco Developer
11 13 (4.14%) Senior Full-Stack Developer
12 12 (3.82%) Lead
13 11 (3.50%) Web Developer
14 9 (2.87%) C# .NET Developer
14 9 (2.87%) Full-Stack .NET Developer
14 9 (2.87%) SQL Developer
15 8 (2.55%) Full-Stack JavaScript Developer
Libraries, Frameworks & Software Standards
1 314 (100.00%) HTML
2 276 (87.90%) CSS
3 213 (67.83%) CSS3
4 181 (57.64%) React
5 160 (50.96%) RESTful
6 125 (39.81%) Sass
7 122 (38.85%) REST
8 120 (38.22%) Jest
9 105 (33.44%) Redux
10 96 (30.57%) Kafka
11 95 (30.25%) .NET
11 95 (30.25%) Spring
11 95 (30.25%) Spring Boot
12 93 (29.62%) JPA
13 90 (28.66%) AngularJS
14 54 (17.20%) ASP.NET
15 49 (15.61%) .NET Core
15 49 (15.61%) Vue
16 42 (13.38%) jQuery
17 33 (10.51%) Node.js
Miscellaneous
1 102 (32.48%) Enterprise Software
2 90 (28.66%) Product Ownership
3 23 (7.32%) Mobile App
4 16 (5.10%) NHS
5 14 (4.46%) Cloud Native
5 14 (4.46%) Foreign Exchange (FX)
6 8 (2.55%) Animation
7 6 (1.91%) Digital TV
7 6 (1.91%) Self-Motivation
7 6 (1.91%) Social Media
8 5 (1.59%) Derivative
8 5 (1.59%) Online Games
8 5 (1.59%) Virtual Team
9 4 (1.27%) Augmented Reality
9 4 (1.27%) Digital Media
9 4 (1.27%) Graphic Design
9 4 (1.27%) Photography
9 4 (1.27%) Team-Oriented Environment
9 4 (1.27%) Virtual Reality
10 3 (0.96%) Distributed Systems
Operating Systems
1 12 (3.82%) Windows
2 5 (1.59%) Linux
2 5 (1.59%) Unix
3 3 (0.96%) Android
3 3 (0.96%) Apple iOS
4 1 (0.32%) Windows Server
Processes & Methodologies
1 182 (57.96%) Agile
2 160 (50.96%) Full-Stack Development
3 143 (45.54%) User Experience
4 140 (44.59%) CI/CD
5 135 (42.99%) Front End Development
5 135 (42.99%) Microservices
6 126 (40.13%) DevOps
7 125 (39.81%) Software Engineering
8 119 (37.90%) Mentoring
8 119 (37.90%) Responsive Web Design
9 111 (35.35%) Test Automation
10 102 (32.48%) Containerisation
10 102 (32.48%) Performance Optimisation
11 100 (31.85%) SDLC
12 99 (31.53%) Migration
13 90 (28.66%) Strategic Thinking
14 77 (24.52%) MVC
15 71 (22.61%) Problem-Solving
16 56 (17.83%) Web Development
17 38 (12.10%) OO
Programming Languages
1 276 (87.90%) JavaScript
2 182 (57.96%) SQL
3 160 (50.96%) TypeScript
4 104 (33.12%) Java
5 96 (30.57%) C#
6 32 (10.19%) PHP
7 19 (6.05%) Python
8 6 (1.91%) C++
8 6 (1.91%) T-SQL
9 4 (1.27%) C
9 4 (1.27%) Shell Script
10 3 (0.96%) Groovy
10 3 (0.96%) Kotlin
11 2 (0.64%) Apex Code
11 2 (0.64%) SOQL
11 2 (0.64%) VB.NET
12 1 (0.32%) Bash
12 1 (0.32%) C-shell
12 1 (0.32%) Go
12 1 (0.32%) Progress 4GL
Qualifications
1 54 (17.20%) Degree
2 21 (6.69%) Computer Science Degree
3 16 (5.10%) Security Cleared
4 10 (3.18%) SC Cleared
5 6 (1.91%) AWS Certification
5 6 (1.91%) AWS Certified Developer
6 5 (1.59%) DBS Check
7 4 (1.27%) AWS Certified Solutions Architect
8 3 (0.96%) DV Cleared
9 1 (0.32%) Master's Degree
Quality Assurance & Compliance
1 127 (40.45%) Accessibility
2 94 (29.94%) QA
3 19 (6.05%) GDPR
3 19 (6.05%) WCAG
4 1 (0.32%) HL7
4 1 (0.32%) ISO/IEC 27001
4 1 (0.32%) SOC 2
System Software
1 114 (36.31%) Docker
Systems Management
1 109 (34.71%) Kubernetes
2 17 (5.41%) Terraform
3 2 (0.64%) Grafana
3 2 (0.64%) Prometheus
Vendors
1 90 (28.66%) Solace
2 55 (17.52%) Microsoft
3 15 (4.78%) Google
3 15 (4.78%) Oracle
4 14 (4.46%) HP
5 12 (3.82%) Adobe
5 12 (3.82%) Rollbar
6 10 (3.18%) YouTube
7 7 (2.23%) Splunk
8 6 (1.91%) Facebook
9 4 (1.27%) Salesforce
9 4 (1.27%) Twitter
10 3 (0.96%) CA Agile Central
10 3 (0.96%) Dynatrace
10 3 (0.96%) SAP
11 2 (0.64%) Apple
11 2 (0.64%) Databricks
11 2 (0.64%) Netlify
11 2 (0.64%) Sybase
11 2 (0.64%) WooCommerce