VMware ESXi Jobs in England

VMware ESXi (formerly ESX Server)
UK > England

The table below provides summary statistics for permanent job vacancies advertised in England requiring VMware ESXi skills. It includes a benchmarking guide to the annual salaries offered in vacancies that cited VMware ESXi over the 6 months leading up to 21 June 2025, comparing them to the same period in the previous two years.

6 months to
21 Jun 2025
Same period 2024 Same period 2023
Rank 541 483 547
Rank change year-on-year -58 +64 +142
Permanent jobs citing VMware ESXi 144 423 359
As % of all permanent jobs advertised in England 0.29% 0.43% 0.44%
As % of the System Software category 2.41% 3.89% 2.85%
Number of salaries quoted 108 280 307
10th Percentile £34,000 £31,250 £30,500
25th Percentile £45,375 £41,500 £36,250
Median annual salary (50th Percentile) £57,500 £52,500 £48,000
Median % change year-on-year +9.52% +9.38% +3.23%
75th Percentile £72,500 £65,000 £60,000
90th Percentile £84,750 £82,500 £71,750
UK median annual salary £57,500 £52,500 £48,250
% change year-on-year +9.52% +8.81% +1.58%

All System Software Skills
England

VMware ESXi falls under the System Software category. For comparison with the information above, the following table provides summary statistics for all permanent job vacancies requiring system software skills in England.

Permanent vacancies with a requirement for system software skills 5,971 10,887 12,591
As % of all permanent jobs advertised in England 12.08% 11.19% 15.56%
Number of salaries quoted 3,443 8,443 8,732
10th Percentile £27,750 £26,250 £27,750
25th Percentile £35,000 £32,500 £37,360
Median annual salary (50th Percentile) £52,500 £49,881 £55,000
Median % change year-on-year +5.25% -9.31% -
75th Percentile £76,000 £67,500 £77,500
90th Percentile £96,250 £86,200 £95,000
UK median annual salary £52,500 £50,000 £55,000
% change year-on-year +5.00% -9.09% -

VMware ESXi
Job Vacancy Trend in England

Job postings citing VMware ESXi as a proportion of all IT jobs advertised in England.
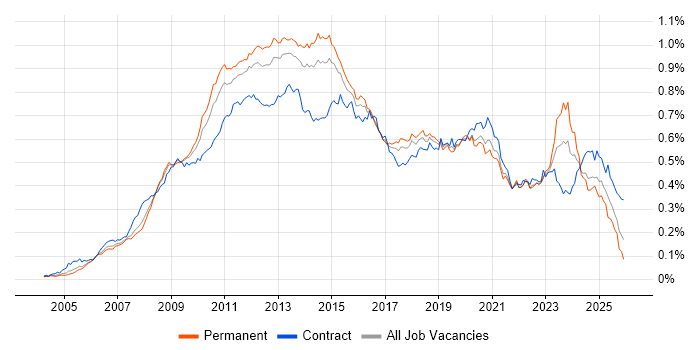
Job vacancy trend for VMware ESXi in England

VMware ESXi
Salary Trend in England

3-month moving average salary quoted in jobs citing VMware ESXi in England.

Salary trend for VMware ESXi in England

VMware ESXi
Salary Histogram in England

Salary distribution for jobs citing VMware ESXi in England over the 6 months to 21 June 2025.

Salary histogram for VMware ESXi in England

VMware ESXi
Job Locations in England

The table below looks at the demand and provides a guide to the median salaries quoted in IT jobs citing VMware ESXi within the England region over the 6 months to 21 June 2025. The 'Rank Change' column provides an indication of the change in demand within each location based on the same 6 month period last year.

Location Rank Change
on Same Period
Last Year
Matching
Permanent
IT Job Ads
Median Salary
Past 6 Months
Median Salary
% Change
on Same Period
Last Year
Live
Jobs
South East +88 53 £50,000 +3.09% 42
London -14 43 £70,000 +7.69% 63
North of England +8 18 £45,000 -10.00% 27
South West +67 17 £60,000 +20.00% 13
North West +17 13 £35,000 -41.67% 20
Midlands +63 11 £57,500 +57.53% 27
East Midlands - 11 £57,500 - 14
Yorkshire +19 5 £75,000 +50.00% 7
East of England +17 2 £76,250 +134.62% 9
VMware ESXi
UK

VMware ESXi
Co-occurring Skills and Capabilities in England by Category

The follow tables expand on the table above by listing co-occurrences grouped by category. The same employment type, locality and period is covered with up to 20 co-occurrences shown in each of the following categories:

Application Platforms
1 30 (20.83%) Microsoft Exchange
2 9 (6.25%) SharePoint
3 3 (2.08%) IIS
4 2 (1.39%) Confluence
5 1 (0.69%) Apache
5 1 (0.69%) nginx
5 1 (0.69%) OpenStack
Applications
1 11 (7.64%) Microsoft Office
Business Applications
1 10 (6.94%) Dynamics NAV
2 4 (2.78%) Fidessa
Cloud Services
1 80 (55.56%) Azure
2 40 (27.78%) Microsoft 365
3 28 (19.44%) AWS
4 15 (10.42%) IaaS
5 11 (7.64%) Entra ID
5 11 (7.64%) GCP
6 7 (4.86%) PaaS
6 7 (4.86%) SaaS
7 6 (4.17%) Nutanix
7 6 (4.17%) OpenShift
8 5 (3.47%) Azure DevOps
8 5 (3.47%) Cloud Computing
9 4 (2.78%) Azure Sentinel
9 4 (2.78%) Mimecast
10 3 (2.08%) Azure ExpressRoute
10 3 (2.08%) Azure Monitor
11 2 (1.39%) OneDrive
12 1 (0.69%) Cohesity
12 1 (0.69%) GitHub
12 1 (0.69%) Power Platform
Communications & Networking
1 53 (36.81%) Firewall
2 50 (34.72%) DHCP
2 50 (34.72%) DNS
3 35 (24.31%) SAN
4 20 (13.89%) Wi-Fi
5 18 (12.50%) VLAN
6 16 (11.11%) Network Security
7 15 (10.42%) NAS
7 15 (10.42%) VPN
8 13 (9.03%) MPLS
9 12 (8.33%) Ethernet
9 12 (8.33%) Remote Desktop
9 12 (8.33%) WAN
10 11 (7.64%) Modbus
10 11 (7.64%) MQTT
11 10 (6.94%) SD-WAN
11 10 (6.94%) VoIP
12 9 (6.25%) SMTP
13 8 (5.56%) TCP/IP
14 6 (4.17%) LAN
Database & Business Intelligence
1 17 (11.81%) SQL Server
2 6 (4.17%) Amazon RDS
3 3 (2.08%) Azure SQL Database
4 2 (1.39%) PostgreSQL
4 2 (1.39%) SAP HANA
Development Applications
1 5 (3.47%) Jenkins
2 3 (2.08%) Git
2 3 (2.08%) JIRA
3 2 (1.39%) Sonatype Nexus
4 1 (0.69%) Atlassian Bamboo
4 1 (0.69%) Bitbucket
4 1 (0.69%) GitLab
General
1 30 (20.83%) Social Skills
2 21 (14.58%) Inclusion and Diversity
2 21 (14.58%) Manufacturing
3 17 (11.81%) Finance
4 12 (8.33%) Banking
5 11 (7.64%) Pharmaceutical
6 10 (6.94%) Legal
7 9 (6.25%) Analytical Skills
8 4 (2.78%) Investment Banking
9 3 (2.08%) Games
9 3 (2.08%) Public Sector
9 3 (2.08%) Retail
10 2 (1.39%) Aerospace
10 2 (1.39%) Law
10 2 (1.39%) Military
10 2 (1.39%) Organisational Skills
11 1 (0.69%) French Language
11 1 (0.69%) German Language
11 1 (0.69%) Retail Banking
11 1 (0.69%) Telecoms
Job Titles
1 41 (28.47%) Infrastructure Engineer
2 24 (16.67%) Support Engineer
3 18 (12.50%) Senior
4 15 (10.42%) Infrastructure Support
4 15 (10.42%) Windows Engineer
5 14 (9.72%) Administrator
5 14 (9.72%) Automation Engineer
6 13 (9.03%) Azure Engineer
6 13 (9.03%) Coordinator
7 12 (8.33%) 3rd Line Engineer
8 10 (6.94%) Help Desk Coordinator
8 10 (6.94%) Infrastructure Support Engineer
8 10 (6.94%) Linux Administrator
8 10 (6.94%) Platform Engineer
8 10 (6.94%) Senior Infrastructure Engineer
8 10 (6.94%) Server Engineer
8 10 (6.94%) Systems Administrator
8 10 (6.94%) VMware Engineer
9 9 (6.25%) IT Engineer
9 9 (6.25%) IT Support
Libraries, Frameworks & Software Standards
1 11 (7.64%) SAML
2 6 (4.17%) .NET
2 6 (4.17%) CSS
3 4 (2.78%) REST
4 3 (2.08%) ARM Templates
4 3 (2.08%) GraphQL
4 3 (2.08%) Middleware
Miscellaneous
1 29 (20.14%) Clustering
2 18 (12.50%) PKI
3 17 (11.81%) Data Centre
4 16 (11.11%) Video Conferencing
5 11 (7.64%) Biopharmaceutical
5 11 (7.64%) Industry 4.0
5 11 (7.64%) IoT
5 11 (7.64%) Operational Technology
5 11 (7.64%) Renewable Energy
5 11 (7.64%) SCADA
6 10 (6.94%) CCTV
7 8 (5.56%) Replication
8 6 (4.17%) Hybrid Cloud
8 6 (4.17%) Legacy Systems
9 4 (2.78%) Hedge funds
9 4 (2.78%) Security Posture
10 3 (2.08%) Distributed Systems
10 3 (2.08%) Linux Command Line
11 2 (1.39%) Analytical Mindset
11 2 (1.39%) Onboarding
Operating Systems
1 118 (81.94%) Windows
2 105 (72.92%) Windows Server
3 61 (42.36%) Linux
4 35 (24.31%) Windows Server 2016
5 16 (11.11%) Windows 10
5 16 (11.11%) Windows Server 2019
6 14 (9.72%) Red Hat Enterprise Linux
7 5 (3.47%) Mac OS
8 4 (2.78%) SUSE Linux Enterprise Server
8 4 (2.78%) Windows Server 2008
8 4 (2.78%) Windows Server 2012
9 3 (2.08%) Windows Server 2003
10 2 (1.39%) AIX
10 2 (1.39%) CentOS
10 2 (1.39%) Debian
10 2 (1.39%) SUSE
10 2 (1.39%) Ubuntu
10 2 (1.39%) Unix
11 1 (0.69%) Android
Processes & Methodologies
1 53 (36.81%) Infrastructure Engineering
2 37 (25.69%) Problem-Solving
3 27 (18.75%) Disaster Recovery
4 26 (18.06%) Virtual Environments
5 24 (16.67%) High Availability
6 21 (14.58%) Project Delivery
7 19 (13.19%) Cybersecurity
7 19 (13.19%) ITIL
8 18 (12.50%) ERP
8 18 (12.50%) Incident Management
9 16 (11.11%) Mentoring
10 14 (9.72%) Platform Engineering
10 14 (9.72%) Time Management
11 13 (9.03%) Patch Management
12 12 (8.33%) Asset Management
12 12 (8.33%) Customer Service
12 12 (8.33%) Infrastructure as Code
12 12 (8.33%) Network Design
12 12 (8.33%) Task Automation
13 11 (7.64%) Risk Assessment
Programming Languages
1 56 (38.89%) PowerShell
2 23 (15.97%) SQL
3 19 (13.19%) Python
4 17 (11.81%) Bash
5 6 (4.17%) C#
5 6 (4.17%) JavaScript
6 2 (1.39%) Korn
6 2 (1.39%) Shell Script
7 1 (0.69%) Java
Qualifications
1 31 (21.53%) Security Cleared
2 26 (18.06%) Degree
3 25 (17.36%) DV Cleared
4 14 (9.72%) VMware Certified Professional (VCP)
5 11 (7.64%) Azure Certification
5 11 (7.64%) Chartered Engineer
5 11 (7.64%) HNC
5 11 (7.64%) HND
5 11 (7.64%) Microsoft Certification
6 8 (5.56%) CCNA
6 8 (5.56%) Cisco Certification
7 7 (4.86%) SC Cleared
8 5 (3.47%) CCNP
9 4 (2.78%) Computer Science Degree
10 3 (2.08%) MCSA
10 3 (2.08%) Network+ Certification
11 2 (1.39%) MCP
11 2 (1.39%) MCSE
12 1 (0.69%) Dell Certification
12 1 (0.69%) ITIL Certification
Quality Assurance & Compliance
1 6 (4.17%) SLA
2 3 (2.08%) GDPR
2 3 (2.08%) HIPAA
2 3 (2.08%) SOC 2
3 1 (0.69%) Government Security Classifications
3 1 (0.69%) ISO/IEC 27001
System Software
1 102 (70.83%) VMware Infrastructure
2 83 (57.64%) Active Directory
3 45 (31.25%) Hyper-V
4 36 (25.00%) vSphere
5 24 (16.67%) Docker
6 14 (9.72%) Virtual Machines
7 8 (5.56%) BitLocker
7 8 (5.56%) Microsoft App-V
7 8 (5.56%) Terminal Services
8 5 (3.47%) VMware NSX
9 4 (2.78%) Firmware
9 4 (2.78%) Virtual Desktop
10 2 (1.39%) Microsoft Virtual Server
10 2 (1.39%) Virtual Servers
10 2 (1.39%) VMware Workstation
11 1 (0.69%) NFS
11 1 (0.69%) vCloud
11 1 (0.69%) VMware Server
Systems Management
1 39 (27.08%) Ansible
2 36 (25.00%) vCenter Server
3 20 (13.89%) Kubernetes
4 18 (12.50%) Terraform
5 16 (11.11%) Microsoft Intune
6 14 (9.72%) Puppet
6 14 (9.72%) vMotion
7 11 (7.64%) Functional Safety
8 10 (6.94%) Single Sign-On
9 7 (4.86%) Active Directory Federation Services
9 7 (4.86%) Nagios
9 7 (4.86%) PowerCLI
9 7 (4.86%) vRealize
10 5 (3.47%) SCCM
11 4 (2.78%) Red Hat Satellite
11 4 (2.78%) ZENworks
12 3 (2.08%) SCOM
13 2 (1.39%) Grafana
13 2 (1.39%) WSUS
13 2 (1.39%) ZABBIX
Vendors
1 137 (95.14%) VMware
2 93 (64.58%) Microsoft
3 39 (27.08%) Veeam
4 25 (17.36%) Citrix
5 20 (13.89%) Cisco
6 17 (11.81%) HP
7 11 (7.64%) AVEVA
7 11 (7.64%) NetApp
7 11 (7.64%) Rockwell
7 11 (7.64%) Siemens
8 7 (4.86%) Extreme Networks
8 7 (4.86%) Fortinet
8 7 (4.86%) Meraki
9 6 (4.17%) EMC
9 6 (4.17%) Google
9 6 (4.17%) Sophos
9 6 (4.17%) Symantec
10 5 (3.47%) Dell
10 5 (3.47%) IBM
10 5 (3.47%) Red Hat