Shell Script Jobs in England

Shell Scripting (Shell Programming)
UK > England

The table below provides summary statistics for permanent job vacancies advertised in England requiring Shell Script skills. It includes a benchmarking guide to the annual salaries offered in vacancies that cited Shell Script over the 6 months leading up to 3 July 2025, comparing them to the same period in the previous two years.

6 months to
3 Jul 2025
Same period 2024 Same period 2023
Rank 556 637 498
Rank change year-on-year +81 -139 -121
Permanent jobs citing Shell Script 138 230 426
As % of all permanent jobs advertised in England 0.27% 0.24% 0.54%
As % of the Programming Languages category 0.92% 0.80% 1.30%
Number of salaries quoted 73 158 231
10th Percentile - £43,875 £41,250
25th Percentile £38,500 £51,250 £48,125
Median annual salary (50th Percentile) £60,000 £70,000 £65,500
Median % change year-on-year -14.29% +6.87% +12.93%
75th Percentile £80,000 £87,500 £87,500
90th Percentile £95,000 £100,000 £110,000
UK median annual salary £60,000 £67,500 £65,500
% change year-on-year -11.11% +3.05% +12.93%

All Programming Languages
England

Shell Script falls under the Programming Languages category. For comparison with the information above, the following table provides summary statistics for all permanent job vacancies requiring coding skills in England.

Permanent vacancies with a requirement for coding skills 15,057 28,912 32,757
As % of all permanent jobs advertised in England 29.25% 30.75% 41.55%
Number of salaries quoted 9,666 22,688 23,031
10th Percentile £36,250 £35,000 £39,750
25th Percentile £47,683 £45,000 £50,000
Median annual salary (50th Percentile) £62,500 £60,000 £65,000
Median % change year-on-year +4.17% -7.69% +4.00%
75th Percentile £82,751 £80,000 £87,500
90th Percentile £110,000 £100,000 £110,000
UK median annual salary £60,000 £60,000 £65,000
% change year-on-year - -7.69% +4.00%

Shell Script
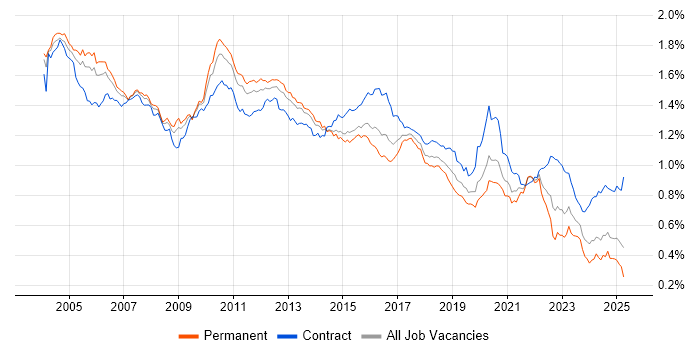
Job Vacancy Trend in England

Job postings citing Shell Script as a proportion of all IT jobs advertised in England.

Job vacancy trend for Shell Script in England

Shell Script
Salary Trend in England

3-month moving average salary quoted in jobs citing Shell Script in England.

Salary trend for Shell Script in England

Shell Script
Salary Histogram in England

Salary distribution for jobs citing Shell Script in England over the 6 months to 3 July 2025.

Salary histogram for Shell Script in England

Shell Script
Job Locations in England

The table below looks at the demand and provides a guide to the median salaries quoted in IT jobs citing Shell Script within the England region over the 6 months to 3 July 2025. The 'Rank Change' column provides an indication of the change in demand within each location based on the same 6 month period last year.

Location Rank Change
on Same Period
Last Year
Matching
Permanent
IT Job Ads
Median Salary
Past 6 Months
Median Salary
% Change
on Same Period
Last Year
Live
Jobs
London +110 91 £73,750 -7.81% 87
South East +64 29 £41,000 -1.20% 27
Midlands +71 18 £57,500 +15.00% 19
West Midlands +73 13 £58,750 +32.02% 10
North of England +49 13 £44,500 -8.26% 20
North West +6 12 £44,500 -56.59% 11
East of England +22 9 £39,000 -35.00% 14
East Midlands +40 5 £57,500 +9.52% 9
South West +84 2 £60,000 -25.00% 17
Yorkshire +44 1 - - 7
Shell Script
UK

Shell Script
Co-occurring Skills and Capabilities in England by Category

The follow tables expand on the table above by listing co-occurrences grouped by category. The same employment type, locality and period is covered with up to 20 co-occurrences shown in each of the following categories:

Application Platforms
1 4 (2.90%) Jupyter
2 3 (2.17%) Apache Airflow
2 3 (2.17%) Confluence
3 2 (1.45%) Oracle Workflow
3 2 (1.45%) SAS
3 2 (1.45%) Tomcat
4 1 (0.72%) JBoss
4 1 (0.72%) nginx
4 1 (0.72%) Oracle Application Server
4 1 (0.72%) WebLogic
4 1 (0.72%) WebSphere
Applications
1 15 (10.87%) Chatbot
2 7 (5.07%) Mozilla Thunderbird
3 2 (1.45%) EngageOne
4 1 (0.72%) PlantUML
Business Applications
1 4 (2.90%) Oracle EBS
2 3 (2.17%) Oracle Applications
3 1 (0.72%) Oracle EBS R12
3 1 (0.72%) Oracle General Ledger
3 1 (0.72%) Oracle Payables
3 1 (0.72%) Oracle Receivables
Cloud Services
1 63 (45.65%) AWS
2 29 (21.01%) Amazon ECS
3 27 (19.57%) Azure
3 27 (19.57%) Serverless
4 24 (17.39%) Amazon EC2
5 22 (15.94%) Amazon EKS
6 10 (7.25%) Amazon S3
7 9 (6.52%) GitHub
8 8 (5.80%) AWS Lambda
8 8 (5.80%) Virtual Private Cloud
9 7 (5.07%) Amazon GuardDuty
9 7 (5.07%) AWS KMS
9 7 (5.07%) GCP
9 7 (5.07%) GitHub Actions
9 7 (5.07%) SaaS
10 6 (4.35%) Cloud Computing
11 5 (3.62%) BlazeMeter
11 5 (3.62%) Datadog
11 5 (3.62%) OpenShift
12 4 (2.90%) Amazon CloudWatch
Communications & Networking
1 10 (7.25%) Firewall
2 9 (6.52%) SSL
3 6 (4.35%) TCP/IP
4 4 (2.90%) Network Security
5 2 (1.45%) SAN
5 2 (1.45%) VPN
6 1 (0.72%) Asterisk PBX
6 1 (0.72%) DHCP
6 1 (0.72%) DNS
6 1 (0.72%) HTTP
6 1 (0.72%) HTTPS
6 1 (0.72%) OpenLDAP
6 1 (0.72%) RTP
6 1 (0.72%) VLAN
6 1 (0.72%) VoIP
Database & Business Intelligence
1 29 (21.01%) Relational Database
2 28 (20.29%) PostgreSQL
3 21 (15.22%) RDBMS
4 12 (8.70%) MySQL
5 8 (5.80%) Oracle Database
5 8 (5.80%) SQL Server
6 6 (4.35%) MongoDB
6 6 (4.35%) Redis
7 5 (3.62%) Amazon RDS
8 4 (2.90%) KDB
8 4 (2.90%) Kdb+
9 3 (2.17%) Elasticsearch
9 3 (2.17%) Oracle Exadata
10 2 (1.45%) Big Data
10 2 (1.45%) Data Warehouse
10 2 (1.45%) DB2
10 2 (1.45%) Metadata
10 2 (1.45%) Pentaho
10 2 (1.45%) SAP HANA
10 2 (1.45%) Triplestore
Development Applications
1 52 (37.68%) Jenkins
2 25 (18.12%) Git
3 24 (17.39%) JUnit
4 22 (15.94%) Mockito
5 19 (13.77%) JMeter
6 12 (8.70%) JIRA
7 10 (7.25%) Maven
8 7 (5.07%) Bitbucket Server
8 7 (5.07%) GitLab
9 4 (2.90%) Artifactory
9 4 (2.90%) Atlassian Bamboo
9 4 (2.90%) Bitbucket
9 4 (2.90%) SonarQube
9 4 (2.90%) Subversion
10 3 (2.17%) Postman
10 3 (2.17%) REST Assured
10 3 (2.17%) SoapUI
10 3 (2.17%) Vagrant
10 3 (2.17%) Xcode
10 3 (2.17%) XCTest
General
1 40 (28.99%) Social Skills
2 39 (28.26%) Finance
3 27 (19.57%) Analytical Skills
4 26 (18.84%) Inclusion and Diversity
5 23 (16.67%) Public Sector
6 17 (12.32%) Law
7 11 (7.97%) Marketing
8 9 (6.52%) Banking
8 9 (6.52%) Retail
9 8 (5.80%) Manufacturing
10 7 (5.07%) Legal
10 7 (5.07%) Telecoms
11 4 (2.90%) Front Office
12 3 (2.17%) Billing
12 3 (2.17%) Cantonese Language
13 2 (1.45%) Advertising
13 2 (1.45%) Mandarin Language
13 2 (1.45%) Organisational Skills
13 2 (1.45%) Presentation Skills
14 1 (0.72%) Aviation
Job Titles
1 27 (19.57%) Developer
2 25 (18.12%) Senior
3 20 (14.49%) Linux Engineer
4 19 (13.77%) Java Developer
4 19 (13.77%) Linux Support
5 18 (13.04%) Lead
6 17 (12.32%) Support Engineer
7 16 (11.59%) Software Engineer
8 15 (10.87%) Linux Support Engineer
9 12 (8.70%) Applications Support
9 12 (8.70%) Full-Stack Developer
10 10 (7.25%) Full-Stack Java Developer
11 9 (6.52%) Analyst
11 9 (6.52%) DevOps Engineer
11 9 (6.52%) Support Analyst
12 8 (5.80%) Database Engineer
12 8 (5.80%) Lead Software Engineer
13 7 (5.07%) Applications Support Analyst
13 7 (5.07%) Platform Engineer
14 6 (4.35%) Data Engineer
Libraries, Frameworks & Software Standards
1 38 (27.54%) REST
2 26 (18.84%) Spring
3 25 (18.12%) HTML
4 24 (17.39%) Hibernate
4 24 (17.39%) Spring Boot
5 22 (15.94%) Web Services
6 20 (14.49%) XML
7 19 (13.77%) ActiveMQ
7 19 (13.77%) Apache Camel
7 19 (13.77%) jQuery
7 19 (13.77%) WireMock
8 17 (12.32%) JSON
9 10 (7.25%) React
10 8 (5.80%) OAuth
10 8 (5.80%) OpenID
11 7 (5.07%) Middleware
12 6 (4.35%) Pandas
13 4 (2.90%) AngularJS
13 4 (2.90%) HTML5
13 4 (2.90%) Kafka
Miscellaneous
1 24 (17.39%) Distributed Systems
2 20 (14.49%) Linux Command Line
3 13 (9.42%) Data Structures
4 9 (6.52%) Algorithms
5 8 (5.80%) Private Cloud
5 8 (5.80%) Product Ownership
5 8 (5.80%) Public Cloud
6 7 (5.07%) Manufacturing Execution System
7 6 (4.35%) Clustering
7 6 (4.35%) Derivative
8 5 (3.62%) Equities
8 5 (3.62%) Management Information System
9 4 (2.90%) Foreign Exchange (FX)
10 3 (2.17%) Cloud Native
10 3 (2.17%) Replication
11 2 (1.45%) Equity Derivative
11 2 (1.45%) Legacy Systems
11 2 (1.45%) Security Posture
11 2 (1.45%) Tandem
12 1 (0.72%) Legacy Applications
Operating Systems
1 81 (58.70%) Linux
2 39 (28.26%) Unix
3 18 (13.04%) Windows
4 15 (10.87%) Mac OS
5 8 (5.80%) Red Hat Enterprise Linux
5 8 (5.80%) Ubuntu
6 5 (3.62%) VMS
7 4 (2.90%) Windows Server
8 2 (1.45%) AIX
8 2 (1.45%) SUSE Linux Enterprise Server
9 1 (0.72%) CentOS
9 1 (0.72%) Debian
Processes & Methodologies
1 58 (42.03%) Agile
2 56 (40.58%) Problem-Solving
3 46 (33.33%) CI/CD
4 39 (28.26%) DevOps
5 36 (26.09%) TDD
6 30 (21.74%) Microservices
7 26 (18.84%) Software Engineering
8 25 (18.12%) SDLC
9 21 (15.22%) Workflow
10 19 (13.77%) Artificial Intelligence
10 19 (13.77%) BDD
10 19 (13.77%) Computer Science
10 19 (13.77%) Continuous Improvement
10 19 (13.77%) Process Management
10 19 (13.77%) Test Automation
11 18 (13.04%) Continuous Integration
11 18 (13.04%) Problem Management
12 16 (11.59%) Asset Management
13 15 (10.87%) Conversational UI
14 14 (10.14%) Collaborative Working
Programming Languages
1 81 (58.70%) Python
2 51 (36.96%) SQL
3 48 (34.78%) Java
4 24 (17.39%) JavaScript
5 22 (15.94%) Bash
6 20 (14.49%) PL/SQL
7 13 (9.42%) PowerShell
8 9 (6.52%) Korn
9 8 (5.80%) Perl
9 8 (5.80%) TypeScript
10 7 (5.07%) C-shell
10 7 (5.07%) Go
10 7 (5.07%) Groovy
11 6 (4.35%) C++
12 5 (3.62%) SPARQL
13 3 (2.17%) Gremlin
13 3 (2.17%) Ruby
14 1 (0.72%) ActionScript 2.0
14 1 (0.72%) C
14 1 (0.72%) XPath
Qualifications
1 23 (16.67%) Security Cleared
2 16 (11.59%) SC Cleared
3 15 (10.87%) Degree
4 12 (8.70%) Computer Science Degree
5 7 (5.07%) AWS Certification
5 7 (5.07%) PhD
6 4 (2.90%) ITIL Certification
7 3 (2.17%) OCA
7 3 (2.17%) OCP
7 3 (2.17%) Oracle Certification
8 2 (1.45%) CASP
8 2 (1.45%) CISM
8 2 (1.45%) CISSP
8 2 (1.45%) CompTIA Security+
9 1 (0.72%) AWS Certified DevOps Engineer
9 1 (0.72%) AWS Certified SysOps Administrator
9 1 (0.72%) BPSS Clearance
9 1 (0.72%) DV Cleared
Quality Assurance & Compliance
1 8 (5.80%) QA
2 7 (5.07%) SLA
3 3 (2.17%) Accessibility
4 2 (1.45%) Cyber Essentials
4 2 (1.45%) Dublin Core
4 2 (1.45%) ISO/IEC 27001
System Software
1 58 (42.03%) Docker
2 13 (9.42%) Virtual Machines
3 12 (8.70%) Active Directory
4 8 (5.80%) VMware Infrastructure
5 7 (5.07%) Virtual Desktop
6 6 (4.35%) Veritas Cluster Server
7 2 (1.45%) VMware ESXi
7 2 (1.45%) VMware NSX
7 2 (1.45%) vSphere
8 1 (0.72%) Corosync
8 1 (0.72%) Embedded Firmware
8 1 (0.72%) Firmware
8 1 (0.72%) Kamailio
8 1 (0.72%) KVM
Systems Management
1 47 (34.06%) Kubernetes
2 36 (26.09%) Ansible
3 21 (15.22%) Kibana
4 19 (13.77%) Terraform
5 17 (12.32%) Microsoft Intune
6 16 (11.59%) Grafana
7 8 (5.80%) Nessus
7 8 (5.80%) Prometheus
8 7 (5.07%) Proxmox
9 5 (3.62%) Progress Chef
10 3 (2.17%) Nagios
10 3 (2.17%) Oracle RMAN
10 3 (2.17%) Packer
11 2 (1.45%) FortiGate
11 2 (1.45%) logstash
11 2 (1.45%) Red Hat Satellite
11 2 (1.45%) SCCM
11 2 (1.45%) ZABBIX
12 1 (0.72%) Icinga
12 1 (0.72%) Puppet
Vendors
1 37 (26.81%) Oracle
2 34 (24.64%) Splunk
3 32 (23.19%) Dynatrace
4 20 (14.49%) Microsoft
5 15 (10.87%) Apple
6 13 (9.42%) Google
7 9 (6.52%) VMware
8 8 (5.80%) Red Hat
9 7 (5.07%) Juniper
10 6 (4.35%) Veritas
11 5 (3.62%) AppDynamics
11 5 (3.62%) Talend
12 4 (2.90%) IBM
12 4 (2.90%) SAP
12 4 (2.90%) Symantec
13 3 (2.17%) CA Agile Central
14 2 (1.45%) Informatica
15 1 (0.72%) Cognos
15 1 (0.72%) Sophos
15 1 (0.72%) Sybase