Architectural Patterns Jobs in London

Architectural Patterns
England > London

The table below provides summary statistics for permanent job vacancies advertised in London requiring Architectural Patterns skills. It includes a benchmarking guide to the annual salaries offered in vacancies that cited Architectural Patterns over the 6 months leading up to 4 May 2025, comparing them to the same period in the previous two years.

6 months to
4 May 2025
Same period 2024 Same period 2023
Rank 276 350 260
Rank change year-on-year +74 -90 -13
Permanent jobs citing Architectural Patterns 124 153 472
As % of all permanent jobs advertised in London 0.97% 0.65% 1.34%
As % of the Processes & Methodologies category 1.01% 0.71% 1.40%
Number of salaries quoted 68 95 199
10th Percentile £60,000 £62,500 £64,750
25th Percentile £63,750 £75,625 £70,735
Median annual salary (50th Percentile) £80,875 £85,000 £90,000
Median % change year-on-year -4.85% -5.56% -
75th Percentile £89,100 £95,000 £102,500
90th Percentile £110,750 £114,500 £115,500
England median annual salary £80,000 £70,000 £80,294
% change year-on-year +14.29% -12.82% -2.67%

All Process and Methodology Skills
London

Architectural Patterns falls under the Processes and Methodologies category. For comparison with the information above, the following table provides summary statistics for all permanent job vacancies requiring process or methodology skills in London.

Permanent vacancies with a requirement for process or methodology skills 12,242 21,582 33,665
As % of all permanent jobs advertised in London 96.05% 91.32% 95.37%
Number of salaries quoted 7,472 16,066 24,126
10th Percentile £42,500 £38,000 £43,465
25th Percentile £56,250 £52,000 £55,000
Median annual salary (50th Percentile) £75,000 £70,000 £75,000
Median % change year-on-year +7.14% -6.67% +7.14%
75th Percentile £100,000 £95,000 £95,000
90th Percentile £123,750 £115,000 £115,000
England median annual salary £57,500 £55,000 £62,500
% change year-on-year +4.55% -12.00% +4.17%

Architectural Patterns
Job Vacancy Trend in London

Job postings citing Architectural Patterns as a proportion of all IT jobs advertised in London.
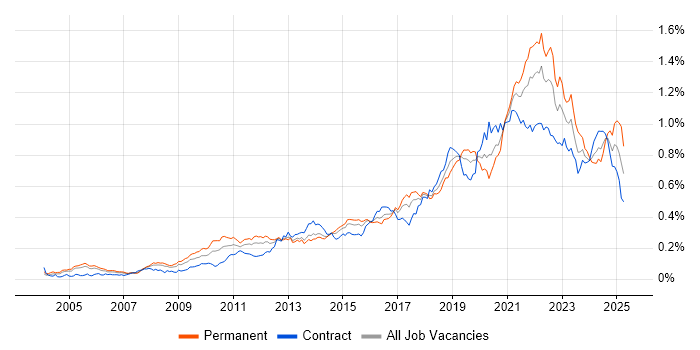
Job vacancy trend for Architectural Patterns in London

Architectural Patterns
Salary Trend in London

3-month moving average salary quoted in jobs citing Architectural Patterns in London.

Salary trend for Architectural Patterns in London

Architectural Patterns
Salary Histogram in London

Salary distribution for jobs citing Architectural Patterns in London over the 6 months to 4 May 2025.

Salary histogram for Architectural Patterns in London

Architectural Patterns
Job Locations in London

The table below looks at the demand and provides a guide to the median salaries quoted in IT jobs citing Architectural Patterns within the London region over the 6 months to 4 May 2025. The 'Rank Change' column provides an indication of the change in demand within each location based on the same 6 month period last year.

Location Rank Change
on Same Period
Last Year
Matching
Permanent
IT Job Ads
Median Salary
Past 6 Months
Median Salary
% Change
on Same Period
Last Year
Live
Jobs
Central London +42 25 £97,500 +21.88% 14
South London +15 4 £60,000 -25.00%
Architectural Patterns
England

Architectural Patterns
Co-occurring Skills and Capabilities in London by Category

The follow tables expand on the table above by listing co-occurrences grouped by category. The same employment type, locality and period is covered with up to 20 co-occurrences shown in each of the following categories:

Application Platforms
1 4 (3.23%) Confluence
2 2 (1.61%) Apache Spark
2 2 (1.61%) Microsoft Exchange
2 2 (1.61%) SharePoint
3 1 (0.81%) Apache
Applications
1 11 (8.87%) Maya
2 5 (4.03%) MS Visio
Business Applications
1 11 (8.87%) Dynamics CRM
2 3 (2.42%) SAP CX
3 2 (1.61%) Sparx Enterprise Architect
Cloud Services
1 41 (33.06%) GCP
2 40 (32.26%) AWS
3 30 (24.19%) Azure
4 27 (21.77%) SaaS
5 20 (16.13%) Serverless
6 17 (13.71%) AWS Lambda
7 16 (12.90%) AWS CloudFormation
8 13 (10.48%) AWS KMS
9 11 (8.87%) Boomi
9 11 (8.87%) Salesforce Commerce Cloud
10 10 (8.06%) Power Platform
11 8 (6.45%) GitHub
11 8 (6.45%) GitHub Actions
12 7 (5.65%) Azure DevOps
13 5 (4.03%) Dynamics 365
14 3 (2.42%) Oracle CX
14 3 (2.42%) Virtual Private Cloud
15 2 (1.61%) Cloud Functions
15 2 (1.61%) Google Compute Engine
15 2 (1.61%) Microsoft Purview
Communications & Networking
1 19 (15.32%) Network Security
2 6 (4.84%) Firewall
3 2 (1.61%) DNS
3 2 (1.61%) Intrusion Detection
3 2 (1.61%) Unified Communications
4 1 (0.81%) Cisco ISE
4 1 (0.81%) Cisco Nexus
4 1 (0.81%) LAN
4 1 (0.81%) MPLS
4 1 (0.81%) SD-WAN
4 1 (0.81%) Software-Defined Networking
4 1 (0.81%) WAN
4 1 (0.81%) WLAN
Database & Business Intelligence
1 21 (16.94%) NoSQL
2 12 (9.68%) Data Lake
2 12 (9.68%) Tableau
3 9 (7.26%) PostgreSQL
3 9 (7.26%) Power BI
4 8 (6.45%) RDBMS
4 8 (6.45%) Relational Database
5 2 (1.61%) Big Data
5 2 (1.61%) BigQuery
5 2 (1.61%) Data Warehouse
6 1 (0.81%) Amazon Athena
6 1 (0.81%) Azure SQL Database
6 1 (0.81%) Data Mart
6 1 (0.81%) Delta Lake
6 1 (0.81%) DynamoDB
6 1 (0.81%) Elasticsearch
6 1 (0.81%) Electronic Patient Records
6 1 (0.81%) Metadata
6 1 (0.81%) MongoDB
6 1 (0.81%) Neo4j
Development Applications
1 11 (8.87%) Git
2 8 (6.45%) Gradle
2 8 (6.45%) Jenkins
2 8 (6.45%) SonarQube
3 3 (2.42%) JIRA
4 1 (0.81%) Atlassian Bamboo
4 1 (0.81%) Bitbucket
4 1 (0.81%) Cucumber
4 1 (0.81%) Maven
4 1 (0.81%) Octopus Deploy
4 1 (0.81%) Postman
General
1 60 (48.39%) Social Skills
2 45 (36.29%) Finance
3 26 (20.97%) Marketing
4 25 (20.16%) Games
5 18 (14.52%) Analytical Skills
6 14 (11.29%) Law
7 11 (8.87%) Presentation Skills
7 11 (8.87%) Public Sector
7 11 (8.87%) Retail
8 9 (7.26%) Banking
8 9 (7.26%) Electronics
8 9 (7.26%) Manufacturing
8 9 (7.26%) Telecoms
9 5 (4.03%) Inclusion and Diversity
10 4 (3.23%) Influencing Skills
11 3 (2.42%) Financial Institution
12 2 (1.61%) Advertising
12 2 (1.61%) Back Office
12 2 (1.61%) Legal
Job Titles
1 70 (56.45%) Architect
2 53 (42.74%) Senior
3 30 (24.19%) Lead
4 25 (20.16%) Senior Architect
5 20 (16.13%) Developer
6 17 (13.71%) Cloud Architect
7 16 (12.90%) Lead Architect
8 15 (12.10%) IT Architect
8 15 (12.10%) Python Engineer
8 15 (12.10%) Salesforce Architect
9 14 (11.29%) GCP Engineer
10 13 (10.48%) AWS Architect
11 11 (8.87%) CRM Architect
11 11 (8.87%) Solutions Architect
12 9 (7.26%) Senior Developer
12 9 (7.26%) Senior Solutions Architect
12 9 (7.26%) Technical Architect
12 9 (7.26%) Technical Leader
13 8 (6.45%) iOS Developer
13 8 (6.45%) Lead Developer
Libraries, Frameworks & Software Standards
1 24 (19.35%) REST
2 23 (18.55%) Kafka
3 22 (17.74%) FastAPI
4 21 (16.94%) Flask
5 16 (12.90%) Elastic Stack
6 8 (6.45%) Unity (Game Engine)
7 6 (4.84%) OpenAPI
7 6 (4.84%) RabbitMQ
8 5 (4.03%) RESTful
9 4 (3.23%) .NET
9 4 (3.23%) Middleware
10 3 (2.42%) ASP.NET
10 3 (2.42%) React
10 3 (2.42%) Spring
11 2 (1.61%) .NET Framework
11 2 (1.61%) HTML
11 2 (1.61%) Java EE
11 2 (1.61%) Spring Boot
11 2 (1.61%) Web Services
11 2 (1.61%) WinForms
Miscellaneous
1 41 (33.06%) Cloud Native
2 15 (12.10%) Legacy Systems
2 15 (12.10%) Mobile App
3 14 (11.29%) Management Information System
3 14 (11.29%) Mobile Games
4 12 (9.68%) Enterprise Software
5 11 (8.87%) Analytical Mindset
6 4 (3.23%) Distributed Systems
7 3 (2.42%) Greenfield Project
7 3 (2.42%) Product Ownership
8 2 (1.61%) Data Centre
8 2 (1.61%) Legacy Applications
8 2 (1.61%) Public Cloud
8 2 (1.61%) Self-Motivation
9 1 (0.81%) Client/Server
9 1 (0.81%) Data Fabric
9 1 (0.81%) Equities
9 1 (0.81%) IoT
9 1 (0.81%) Low-Code
9 1 (0.81%) Operational Technology
Operating Systems
1 9 (7.26%) Apple iOS
2 8 (6.45%) Android
3 3 (2.42%) Windows
4 1 (0.81%) Linux
Processes & Methodologies
1 63 (50.81%) Problem-Solving
2 54 (43.55%) CI/CD
3 49 (39.52%) Agile
4 43 (34.68%) Containerisation
5 42 (33.87%) Software Engineering
6 41 (33.06%) Microservices
7 40 (32.26%) DevOps
8 34 (27.42%) Design Patterns
8 34 (27.42%) Mentoring
9 33 (26.61%) Event-Driven
9 33 (26.61%) Product Management
10 31 (25.00%) Architectural Design
11 30 (24.19%) Computer Science
12 29 (23.39%) Roadmaps
13 27 (21.77%) Technical Leadership
14 22 (17.74%) Event-Driven Architecture
14 22 (17.74%) Infrastructure as Code
14 22 (17.74%) Integration Patterns
14 22 (17.74%) Process Improvement
15 21 (16.94%) Analytics
Programming Languages
1 34 (27.42%) Java
2 32 (25.81%) Python
3 14 (11.29%) SQL
4 9 (7.26%) Swift
5 8 (6.45%) Kotlin
5 8 (6.45%) Objective-C
6 7 (5.65%) JavaScript
7 6 (4.84%) C#
8 5 (4.03%) Go
9 4 (3.23%) TypeScript
10 3 (2.42%) Bicep
11 2 (1.61%) PowerShell
12 1 (0.81%) Kusto Query Language
12 1 (0.81%) PHP
12 1 (0.81%) Ruby
12 1 (0.81%) Scala
Qualifications
1 44 (35.48%) Degree
2 28 (22.58%) Computer Science Degree
3 25 (20.16%) Security Cleared
4 24 (19.35%) SC Cleared
5 18 (14.52%) AWS Certification
5 18 (14.52%) AWS Certified Solutions Architect
6 4 (3.23%) TOGAF Certification
7 2 (1.61%) Cisco Certification
7 2 (1.61%) CISSP
7 2 (1.61%) DV Cleared
8 1 (0.81%) ACSA
8 1 (0.81%) ACSP
8 1 (0.81%) CCNP
8 1 (0.81%) CCSK
8 1 (0.81%) CCSP
8 1 (0.81%) ISSAP
8 1 (0.81%) Master's Degree
8 1 (0.81%) Microsoft Certification
Quality Assurance & Compliance
1 20 (16.13%) GDPR
2 17 (13.71%) HIPAA
3 16 (12.90%) QA
4 5 (4.03%) ISO/IEC 27001
5 4 (3.23%) Data Quality
6 3 (2.42%) California Consumer Privacy Act
6 3 (2.42%) NIST
6 3 (2.42%) PCI DSS
6 3 (2.42%) SOC 2
7 1 (0.81%) COBIT
7 1 (0.81%) NCSC
System Software
1 42 (33.87%) Docker
2 1 (0.81%) Active Directory
Systems Management
1 43 (34.68%) Kubernetes
1 43 (34.68%) Terraform
2 16 (12.90%) Grafana
2 16 (12.90%) Prometheus
Vendors
1 31 (25.00%) Google
2 23 (18.55%) Microsoft
3 20 (16.13%) SAP
4 15 (12.10%) Salesforce
5 13 (10.48%) Oracle
6 11 (8.87%) Adobe
6 11 (8.87%) Dell
6 11 (8.87%) MuleSoft
7 8 (6.45%) New Relic
8 3 (2.42%) Informatica
8 3 (2.42%) Zoho
9 2 (1.61%) BiZZdesign
9 2 (1.61%) Cisco
9 2 (1.61%) Hitachi
9 2 (1.61%) Sparx
10 1 (0.81%) CyberArk
10 1 (0.81%) Databricks
10 1 (0.81%) Meraki
10 1 (0.81%) Palo Alto
10 1 (0.81%) StreamSets