Asset Management Jobs in the UK excluding London

Asset Management
UK > UK excluding London

The table below provides summary statistics for permanent job vacancies advertised in the UK excluding London requiring Asset Management skills. It includes a benchmarking guide to the annual salaries offered in vacancies that cited Asset Management over the 6 months leading up to 12 May 2025, comparing them to the same period in the previous two years.

6 months to
12 May 2025
Same period 2024 Same period 2023
Rank 231 211 141
Rank change year-on-year -20 -70 +167
Permanent jobs citing Asset Management 490 970 1,454
As % of all permanent jobs advertised in the UK excluding London 1.25% 1.37% 2.43%
As % of the Processes & Methodologies category 1.35% 1.63% 2.54%
Number of salaries quoted 240 600 508
10th Percentile £25,480 £24,807 £26,250
25th Percentile £32,275 £30,000 £30,500
Median annual salary (50th Percentile) £45,000 £43,500 £32,750
Median % change year-on-year +3.45% +32.82% -18.13%
75th Percentile £76,000 £57,500 £53,750
90th Percentile £76,150 £73,750 £75,000
UK median annual salary £95,000 £80,000 £72,500
% change year-on-year +18.75% +10.34% -14.71%

All Process and Methodology Skills
UK excluding London

Asset Management falls under the Processes and Methodologies category. For comparison with the information above, the following table provides summary statistics for all permanent job vacancies requiring process or methodology skills in the UK excluding London.

Permanent vacancies with a requirement for process or methodology skills 36,419 59,619 57,237
As % of all permanent jobs advertised in the UK excluding London 92.92% 83.98% 95.60%
Number of salaries quoted 18,159 41,251 29,495
10th Percentile £27,000 £27,250 £30,500
25th Percentile £37,716 £36,250 £40,000
Median annual salary (50th Percentile) £52,500 £50,000 £55,000
Median % change year-on-year +5.00% -9.09% +4.76%
75th Percentile £66,100 £65,000 £70,000
90th Percentile £78,750 £77,500 £82,500
UK median annual salary £57,500 £55,000 £61,000
% change year-on-year +4.55% -9.84% +1.67%

Asset Management
Job Vacancy Trend in the UK excluding London

Job postings citing Asset Management as a proportion of all IT jobs advertised in the UK excluding London.
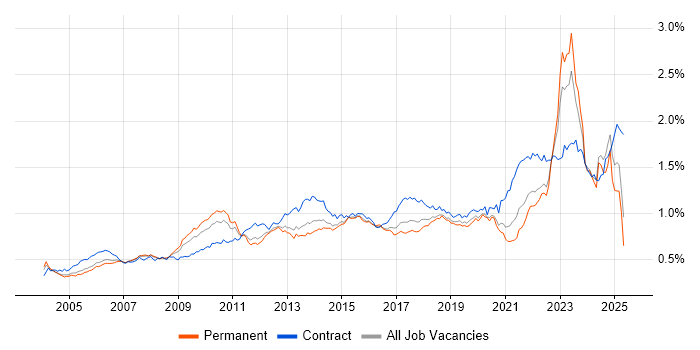
Job vacancy trend for Asset Management in the UK excluding London

Asset Management
Salary Trend in the UK excluding London

3-month moving average salary quoted in jobs citing Asset Management in the UK excluding London.

Salary trend for Asset Management in the UK excluding London

Asset Management
Salary Histogram in the UK excluding London

Salary distribution for jobs citing Asset Management in the UK excluding London over the 6 months to 12 May 2025.

Salary histogram for Asset Management in the UK excluding London

Asset Management
Job Locations in the UK excluding London

The table below looks at the demand and provides a guide to the median salaries quoted in IT jobs citing Asset Management within the UK excluding London region over the 6 months to 12 May 2025. The 'Rank Change' column provides an indication of the change in demand within each location based on the same 6 month period last year.

Location Rank Change
on Same Period
Last Year
Matching
Permanent
IT Job Ads
Median Salary
Past 6 Months
Median Salary
% Change
on Same Period
Last Year
Live
Jobs
East of England +84 131 £76,000 +53.85% 46
South East +14 121 £60,000 +26.32% 190
Midlands +29 116 £38,754 +3.88% 77
North of England -48 77 £29,250 -25.95% 122
West Midlands +10 74 £38,754 -3.12% 50
North West -49 51 £25,480 -38.21% 76
East Midlands +51 42 £27,500 +10.71% 21
Scotland -31 24 £39,961 -9.18% 63
Yorkshire +12 19 £36,500 +2.59% 32
South West +62 14 £45,000 -2.91% 62
North East +28 7 £70,000 +100.00% 18
Northern Ireland +37 5 £40,221 -10.62% 8
Wales +2 2 £77,500 +63.16% 9
Asset Management
UK

Asset Management
Co-occurring Skills and Capabilities in the UK excluding London by Category

The follow tables expand on the table above by listing co-occurrences grouped by category. The same employment type, locality and period is covered with up to 20 co-occurrences shown in each of the following categories:

Application Platforms
1 19 (3.88%) IIS
2 14 (2.86%) SharePoint
3 10 (2.04%) Microsoft Exchange
4 9 (1.84%) nginx
5 5 (1.02%) Jupyter
6 4 (0.82%) CMS
6 4 (0.82%) Drupal
7 3 (0.61%) Apache
7 3 (0.61%) Confluence
8 2 (0.41%) ArcGIS
Applications
1 38 (7.76%) Microsoft PowerPoint
2 32 (6.53%) Microsoft Office
3 25 (5.10%) Microsoft Excel
4 5 (1.02%) Adobe Premiere
4 5 (1.02%) Photoshop
5 1 (0.20%) Adobe After Effects
5 1 (0.20%) Adobe Creative Suite
5 1 (0.20%) Adobe Illustrator
5 1 (0.20%) Blender
5 1 (0.20%) CINEMA 4D
5 1 (0.20%) InDesign
5 1 (0.20%) MS Visio
Business Applications
1 5 (1.02%) Markit EDM
2 4 (0.82%) Remedy ITSM
3 2 (0.41%) Aladdin
4 1 (0.20%) Dynamics CRM
4 1 (0.20%) Maximo
4 1 (0.20%) NEC Housing
4 1 (0.20%) Orchard Housing
Cloud Services
1 100 (20.41%) Power Platform
2 72 (14.69%) Azure
3 62 (12.65%) Microsoft 365
4 49 (10.00%) AWS
5 26 (5.31%) Snowflake
6 24 (4.90%) GCP
7 19 (3.88%) SaaS
8 8 (1.63%) Amazon CloudWatch
9 7 (1.43%) OneDrive
10 6 (1.22%) AWS CloudTrail
10 6 (1.22%) Entra ID
11 4 (0.82%) Google Analytics
11 4 (0.82%) PaaS
12 3 (0.61%) Dynamics 365
13 2 (0.41%) Amazon ELB
13 2 (0.41%) Amazon Glacier
13 2 (0.41%) AWS KMS
13 2 (0.41%) Azure DevOps
13 2 (0.41%) Azure Synapse Analytics
13 2 (0.41%) Virtual Private Cloud
Communications & Networking
1 30 (6.12%) Network Security
2 29 (5.92%) Internet
3 28 (5.71%) WLAN
4 20 (4.08%) Wi-Fi
5 12 (2.45%) Firewall
6 11 (2.24%) 5G
6 11 (2.24%) Bluetooth
6 11 (2.24%) LTE
7 10 (2.04%) LAN
7 10 (2.04%) WAN
8 9 (1.84%) VPN
9 5 (1.02%) DHCP
9 5 (1.02%) DNS
10 4 (0.82%) VoIP
11 3 (0.61%) Cisco Nexus
11 3 (0.61%) TCP/IP
12 2 (0.41%) Remote Desktop
12 2 (0.41%) SAN
12 2 (0.41%) VLAN
12 2 (0.41%) Wireless
Database & Business Intelligence
1 103 (21.02%) GIS
2 99 (20.20%) Power BI
3 95 (19.39%) Geospatial Data
4 94 (19.18%) Power Query
5 29 (5.92%) Data Lake
6 26 (5.31%) Data Warehouse
7 25 (5.10%) Metadata
8 20 (4.08%) SQL Server
9 8 (1.63%) Amazon RDS
10 6 (1.22%) MariaDB
10 6 (1.22%) Tableau
11 5 (1.02%) Dremio
12 1 (0.20%) DB2
12 1 (0.20%) MongoDB
Development Applications
1 10 (2.04%) JIRA
2 6 (1.22%) Sonatype Nexus
3 5 (1.02%) Jenkins
4 3 (0.61%) Git
4 3 (0.61%) GitLab
5 2 (0.41%) Vagrant
6 1 (0.20%) Maven
General
1 151 (30.82%) Social Skills
2 101 (20.61%) Finance
3 76 (15.51%) Analytical Skills
4 62 (12.65%) Inclusion and Diversity
5 50 (10.20%) Law
6 41 (8.37%) Banking
7 40 (8.16%) Financial Institution
8 37 (7.55%) French Language
8 37 (7.55%) German Language
9 17 (3.47%) Legal
10 15 (3.06%) Marketing
11 14 (2.86%) Electronics
11 14 (2.86%) Police
11 14 (2.86%) Retail
12 11 (2.24%) Advertising
12 11 (2.24%) Organisational Skills
13 10 (2.04%) Public Sector
14 9 (1.84%) Local Government
14 9 (1.84%) Social Housing
15 6 (1.22%) Documentation Skills
Job Titles
1 98 (20.00%) Analyst
2 53 (10.82%) Senior
3 51 (10.41%) IT Support
4 48 (9.80%) Lead
5 43 (8.78%) Administrator
6 37 (7.55%) Credit Analyst
6 37 (7.55%) Research Analyst
7 36 (7.35%) Support Engineer
8 33 (6.73%) IT Engineer
9 30 (6.12%) IT Support Engineer
10 28 (5.71%) IT Manager
11 25 (5.10%) Project Manager
12 23 (4.69%) Support Analyst
13 22 (4.49%) IT Analyst
14 20 (4.08%) IT Administrator
15 16 (3.27%) Infrastructure Engineer
16 12 (2.45%) 1st Line Support
16 12 (2.45%) Asset Management Analyst
17 11 (2.24%) Lead Infrastructure Engineer
17 11 (2.24%) Software Analyst
Libraries, Frameworks & Software Standards
1 15 (3.06%) .NET
2 1 (0.20%) ADO
2 1 (0.20%) Blazor
2 1 (0.20%) LDAP
2 1 (0.20%) Middleware
2 1 (0.20%) React
2 1 (0.20%) YAML
Miscellaneous
1 94 (19.18%) Algorithms
2 43 (8.78%) Driving Licence
3 37 (7.55%) Credit Risk
3 37 (7.55%) Fixed Income
4 30 (6.12%) Onboarding
5 22 (4.49%) Management Information System
6 21 (4.29%) CMDB
6 21 (4.29%) Social Media
7 16 (3.27%) Data Protection Act
8 13 (2.65%) Client/Server
8 13 (2.65%) Private Cloud
9 11 (2.24%) IoT
9 11 (2.24%) NB-IoT
10 10 (2.04%) Housing Association
11 9 (1.84%) Data Centre
12 7 (1.43%) Renewable Energy
13 5 (1.02%) Equities
13 5 (1.02%) Product Ownership
13 5 (1.02%) Reference Data
13 5 (1.02%) SCADA
Operating Systems
1 92 (18.78%) Windows
2 51 (10.41%) Linux
3 18 (3.67%) Windows Server
4 8 (1.63%) Apple iOS
5 5 (1.02%) Mac OS
5 5 (1.02%) Red Hat Enterprise Linux
6 4 (0.82%) Windows 10
7 3 (0.61%) Android
8 2 (0.41%) CentOS
8 2 (0.41%) Ubuntu
8 2 (0.41%) VMS
8 2 (0.41%) Windows Server 2016
9 1 (0.20%) Debian
9 1 (0.20%) Windows 7
Processes & Methodologies
1 168 (34.29%) Problem-Solving
2 135 (27.55%) Data Management
3 121 (24.69%) Service Delivery
4 101 (20.61%) Business Intelligence
5 97 (19.80%) Actionable Insight
5 97 (19.80%) Strategic Planning
6 93 (18.98%) IT Asset Management
7 86 (17.55%) ITIL
8 81 (16.53%) Stakeholder Management
9 66 (13.47%) Decision-Making
10 61 (12.45%) Customer Service
11 51 (10.41%) Mentoring
12 45 (9.18%) Business Strategy
12 45 (9.18%) Risk Management
13 44 (8.98%) Analytics
14 42 (8.57%) Continuous Improvement
15 40 (8.16%) Risk Assessment
16 37 (7.55%) Computer Science
16 37 (7.55%) Financial Modelling
16 37 (7.55%) Portfolio Management
Programming Languages
1 127 (25.92%) SQL
2 45 (9.18%) Python
3 17 (3.47%) PowerShell
4 16 (3.27%) Bash
5 1 (0.20%) C#
5 1 (0.20%) Groovy
5 1 (0.20%) JavaScript
5 1 (0.20%) Shell Script
5 1 (0.20%) TypeScript
5 1 (0.20%) VB
5 1 (0.20%) VBA
Qualifications
1 159 (32.45%) Degree
2 50 (10.20%) Master's Degree
3 38 (7.76%) Microsoft Certification
4 37 (7.55%) CFA
5 33 (6.73%) MCSE
6 32 (6.53%) Computer Science Degree
7 30 (6.12%) Cisco Certification
8 29 (5.92%) CCNA
8 29 (5.92%) CCNP
9 28 (5.71%) LPIC
9 28 (5.71%) MCP
10 22 (4.49%) DBS Check
11 21 (4.29%) ITIL Certification
12 12 (2.45%) Network+ Certification
12 12 (2.45%) Security Cleared
13 11 (2.24%) CompTIA Security+
14 7 (1.43%) HND
14 7 (1.43%) MRICS
15 6 (1.22%) HNC
16 5 (1.02%) SC Cleared
Quality Assurance & Compliance
1 39 (7.96%) SLA
2 32 (6.53%) Data Quality
3 30 (6.12%) Accessibility
4 27 (5.51%) QA
5 12 (2.45%) GDPR
6 8 (1.63%) Sarbanes-Oxley
7 3 (0.61%) COSHH
7 3 (0.61%) Cyber Essentials
7 3 (0.61%) ISO/IEC 27001
8 2 (0.41%) ISO/IEC 19770
9 1 (0.20%) MIL-STD-1553
9 1 (0.20%) NCSC
9 1 (0.20%) NIST
9 1 (0.20%) PMO
System Software
1 58 (11.84%) Active Directory
2 18 (3.67%) VMware Infrastructure
3 11 (2.24%) vSphere
4 10 (2.04%) Firmware
5 7 (1.43%) BitLocker
6 4 (0.82%) Virtual Desktop
7 3 (0.61%) Docker
7 3 (0.61%) VMware ESXi
8 2 (0.41%) Hyper-V
8 2 (0.41%) Virtual Servers
9 1 (0.20%) DFS Replication
9 1 (0.20%) KVM
Systems Management
1 17 (3.47%) Ansible
2 15 (3.06%) Puppet
3 14 (2.86%) Terraform
4 11 (2.24%) Microsoft Intune
4 11 (2.24%) SCCM
5 3 (0.61%) Graylog
5 3 (0.61%) Jamf Pro
5 3 (0.61%) Nagios
5 3 (0.61%) Rundeck
6 2 (0.41%) Grafana
6 2 (0.41%) Kubernetes
6 2 (0.41%) Prometheus
7 1 (0.20%) FortiGate
7 1 (0.20%) Nessus
7 1 (0.20%) ZABBIX
Vendors
1 137 (27.96%) Microsoft
2 42 (8.57%) Bloomberg
3 36 (7.35%) Cisco
4 34 (6.94%) ServiceNow
5 20 (4.08%) VMware
6 17 (3.47%) Oracle
7 10 (2.04%) HP
8 9 (1.84%) Apple
9 8 (1.63%) MobileIron
10 6 (1.22%) Databricks
10 6 (1.22%) Google
10 6 (1.22%) Juniper
10 6 (1.22%) Snow
11 5 (1.02%) Citrix
11 5 (1.02%) Reuters
11 5 (1.02%) Salesforce
12 4 (0.82%) Dell
12 4 (0.82%) Freshdesk
12 4 (0.82%) McAfee
12 4 (0.82%) Remedy