Data Management Jobs in the UK excluding London

Data Management
UK > UK excluding London

The table below provides summary statistics for permanent job vacancies advertised in the UK excluding London requiring Data Management skills. It includes a benchmarking guide to the annual salaries offered in vacancies that cited Data Management over the 6 months leading up to 28 May 2025, comparing them to the same period in the previous two years.

6 months to
28 May 2025
Same period 2024 Same period 2023
Rank 114 141 230
Rank change year-on-year +27 +89 -42
Permanent jobs citing Data Management 1,051 1,448 927
As % of all permanent jobs advertised in the UK excluding London 2.70% 1.97% 1.59%
As % of the Processes & Methodologies category 2.92% 2.38% 1.66%
Number of salaries quoted 362 792 507
10th Percentile £25,800 £30,803 £35,000
25th Percentile £32,813 £39,000 £45,000
Median annual salary (50th Percentile) £55,000 £53,225 £57,500
Median % change year-on-year +3.33% -7.43% +8.49%
75th Percentile £73,833 £68,750 £77,500
90th Percentile £97,500 £90,000 £93,000
UK median annual salary £66,934 £60,000 £65,000
% change year-on-year +11.56% -7.69% +4.00%

All Process and Methodology Skills
UK excluding London

Data Management falls under the Processes and Methodologies category. For comparison with the information above, the following table provides summary statistics for all permanent job vacancies requiring process or methodology skills in the UK excluding London.

Permanent vacancies with a requirement for process or methodology skills 36,047 60,812 55,780
As % of all permanent jobs advertised in the UK excluding London 92.70% 82.57% 95.55%
Number of salaries quoted 17,118 41,900 28,987
10th Percentile £26,338 £27,300 £30,500
25th Percentile £37,000 £36,250 £40,000
Median annual salary (50th Percentile) £51,645 £50,000 £55,000
Median % change year-on-year +3.29% -9.09% +4.76%
75th Percentile £65,000 £65,000 £70,000
90th Percentile £77,500 £77,500 £82,500
UK median annual salary £57,500 £55,000 £61,000
% change year-on-year +4.55% -9.84% +1.67%

Data Management
Job Vacancy Trend in the UK excluding London

Job postings citing Data Management as a proportion of all IT jobs advertised in the UK excluding London.
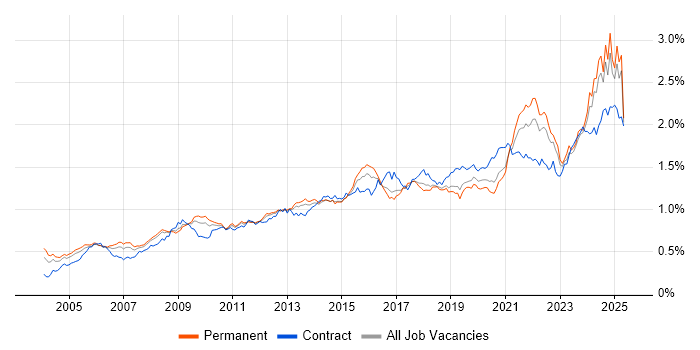
Job vacancy trend for Data Management in the UK excluding London

Data Management
Salary Trend in the UK excluding London

3-month moving average salary quoted in jobs citing Data Management in the UK excluding London.

Salary trend for Data Management in the UK excluding London

Data Management
Salary Histogram in the UK excluding London

Salary distribution for jobs citing Data Management in the UK excluding London over the 6 months to 28 May 2025.

Salary histogram for Data Management in the UK excluding London

Data Management
Job Locations in the UK excluding London

The table below looks at the demand and provides a guide to the median salaries quoted in IT jobs citing Data Management within the UK excluding London region over the 6 months to 28 May 2025. The 'Rank Change' column provides an indication of the change in demand within each location based on the same 6 month period last year.

Location Rank Change
on Same Period
Last Year
Matching
Permanent
IT Job Ads
Median Salary
Past 6 Months
Median Salary
% Change
on Same Period
Last Year
Live
Jobs
South East +48 448 £63,000 +26.00% 835
North of England -68 191 £56,500 +7.62% 602
North West -67 141 £65,000 +23.81% 293
South West +140 127 £62,500 +13.64% 290
Scotland +97 116 £52,000 -13.33% 158
Midlands -56 116 £55,000 - 465
West Midlands -32 71 £62,500 +13.64% 260
East of England +36 45 £35,000 -6.67% 365
Yorkshire -18 45 £27,500 -47.62% 234
East Midlands -13 44 £37,500 -16.67% 177
Northern Ireland +50 10 £57,500 -17.86% 41
North East +14 7 £60,000 - 77
Wales +34 6 £80,000 +71.66% 57
Channel Islands - 2 £87,500 - 9
Data Management
UK

Data Management
Co-occurring Skills and Capabilities in the UK excluding London by Category

The follow tables expand on the table above by listing co-occurrences grouped by category. The same employment type, locality and period is covered with up to 20 co-occurrences shown in each of the following categories:

Application Platforms
1 75 (7.14%) Oracle Application Server
2 33 (3.14%) SharePoint
3 9 (0.86%) Apache Airflow
4 8 (0.76%) Apache Spark
5 6 (0.57%) IBM Domino
6 5 (0.48%) Apache
6 5 (0.48%) SAS
7 4 (0.38%) Appian
8 2 (0.19%) ArcGIS
8 2 (0.19%) Confluence
8 2 (0.19%) Oracle Workflow
9 1 (0.095%) Adobe Experience Manager
9 1 (0.095%) CMS
9 1 (0.095%) Luigi
9 1 (0.095%) WordPress
Applications
1 158 (15.03%) Microsoft Excel
2 39 (3.71%) Microsoft Office
3 34 (3.24%) Microsoft PowerPoint
4 16 (1.52%) Microsoft Project
5 14 (1.33%) Trello
6 13 (1.24%) Windchill
7 1 (0.095%) AutoCAD
7 1 (0.095%) Photoshop
7 1 (0.095%) Revit
7 1 (0.095%) Spreadsheet
Business Applications
1 14 (1.33%) Oracle EBS
2 13 (1.24%) Teamcenter
3 8 (0.76%) NetSuite
4 7 (0.67%) Dynamics CRM
5 5 (0.48%) PeopleSoft Financials
6 4 (0.38%) Oracle Applications
7 3 (0.29%) SAP S/4HANA
7 3 (0.29%) Sparx Enterprise Architect
8 2 (0.19%) Dynamics NAV
8 2 (0.19%) Oracle ERP
8 2 (0.19%) Salesforce CRM
9 1 (0.095%) Infor M3
9 1 (0.095%) iTrent
9 1 (0.095%) Magento
9 1 (0.095%) NEC Housing
9 1 (0.095%) Oracle BPM
9 1 (0.095%) Sprinklr
Cloud Services
1 172 (16.37%) Azure
2 151 (14.37%) Power Platform
3 90 (8.56%) AWS
4 51 (4.85%) GCP
5 35 (3.33%) Snowflake
6 31 (2.95%) PowerApps
7 30 (2.85%) SaaS
8 27 (2.57%) Power Automate
9 21 (2.00%) Cloud Computing
9 21 (2.00%) Microsoft 365
9 21 (2.00%) Salesforce Sales Cloud
10 18 (1.71%) Collibra
11 14 (1.33%) Microsoft Purview
11 14 (1.33%) Salsify
12 12 (1.14%) Azure Data Factory
13 11 (1.05%) Azure DevOps
14 10 (0.95%) Dynamics 365
15 9 (0.86%) Amazon S3
16 6 (0.57%) Serverless
17 5 (0.48%) Datadog
Communications & Networking
1 7 (0.67%) Intranet
2 6 (0.57%) Wireless
3 4 (0.38%) Wi-Fi
4 3 (0.29%) Network Security
4 3 (0.29%) VoIP
5 2 (0.19%) ADSL2
5 2 (0.19%) HTTP
6 1 (0.095%) DHCP
6 1 (0.095%) DNS
6 1 (0.095%) Firewall
6 1 (0.095%) InfiniBand
6 1 (0.095%) Internet
6 1 (0.095%) LAN
6 1 (0.095%) RFID
6 1 (0.095%) Unified Communications
6 1 (0.095%) WAN
Database & Business Intelligence
1 142 (13.51%) Data Warehouse
2 141 (13.42%) Power BI
3 94 (8.94%) Tableau
4 86 (8.18%) Oracle Reports
5 79 (7.52%) Metadata
6 77 (7.33%) Enterprise Data Warehouse
7 59 (5.61%) Data Lake
8 35 (3.33%) Big Data
9 34 (3.24%) SQL Server
10 23 (2.19%) Metadata Repository
11 19 (1.81%) BusinessObjects
11 19 (1.81%) NoSQL
12 18 (1.71%) Data Mining
13 14 (1.33%) SQL Server Reporting Services
14 10 (0.95%) PostgreSQL
14 10 (0.95%) Relational Database
15 9 (0.86%) Ataccama
15 9 (0.86%) BigQuery
16 8 (0.76%) Data Hub
17 7 (0.67%) SQL Server Integration Services
Development Applications
1 55 (5.23%) JIRA
2 8 (0.76%) ERwin
3 6 (0.57%) NDoc
4 5 (0.48%) Jenkins
5 4 (0.38%) Robot Framework
5 4 (0.38%) Selenium
5 4 (0.38%) Snyk
6 3 (0.29%) Oracle Forms
7 2 (0.19%) ER Studio
7 2 (0.19%) Git
7 2 (0.19%) SQL Server Management Studio (SSMS)
7 2 (0.19%) Visual Studio
8 1 (0.095%) Team Foundation Server
General
1 567 (53.95%) Social Skills
2 513 (48.81%) Finance
3 235 (22.36%) Analytical Skills
4 168 (15.98%) Law
5 107 (10.18%) Organisational Skills
6 87 (8.28%) Military
7 72 (6.85%) Marketing
8 64 (6.09%) Retail
9 62 (5.90%) Banking
10 43 (4.09%) Manufacturing
11 36 (3.43%) Legal
12 32 (3.04%) Inclusion and Diversity
13 20 (1.90%) Games
14 16 (1.52%) Public Sector
15 15 (1.43%) Influencing Skills
15 15 (1.43%) Local Government
16 14 (1.33%) Advertising
17 12 (1.14%) Presentation Skills
17 12 (1.14%) Retail Banking
18 10 (0.95%) Billing
Job Titles
1 215 (20.46%) Systems Manager
2 213 (20.27%) Resource Manager
3 149 (14.18%) Lead
4 90 (8.56%) Senior
5 75 (7.14%) Analyst
6 73 (6.95%) Architect
7 54 (5.14%) Data Analyst
8 50 (4.76%) Data Manager
9 40 (3.81%) Administrator
10 37 (3.52%) Developer
11 33 (3.14%) Principal Engineer
12 27 (2.57%) Data Architect
13 26 (2.47%) Procurement Analyst
14 25 (2.38%) Database Engineer
14 25 (2.38%) Senior Manager
15 24 (2.28%) Enterprise Architect
16 21 (2.00%) Junior
16 21 (2.00%) Salesforce Architect
17 19 (1.81%) Data Engineer
18 18 (1.71%) Junior Developer
Libraries, Frameworks & Software Standards
1 27 (2.57%) Middleware
2 25 (2.38%) REST
3 21 (2.00%) Lightning Web Components
3 21 (2.00%) SOAP
4 13 (1.24%) Kafka
5 10 (0.95%) .NET
6 7 (0.67%) React
7 6 (0.57%) EDI
7 6 (0.57%) GraphQL
7 6 (0.57%) JSON
7 6 (0.57%) Oracle Fusion
7 6 (0.57%) RESTful
8 5 (0.48%) Oracle GoldenGate
8 5 (0.48%) PySpark
9 4 (0.38%) AngularJS
9 4 (0.38%) Apache NiFi
10 3 (0.29%) .NET Framework
10 3 (0.29%) ADO
11 2 (0.19%) Leaflet
11 2 (0.19%) XML
Miscellaneous
1 113 (10.75%) Management Information System
2 46 (4.38%) Enterprise Software
3 42 (4.00%) Self-Motivation
4 40 (3.81%) Data Structures
5 26 (2.47%) Social Media
6 18 (1.71%) Onboarding
6 18 (1.71%) Product Ownership
7 17 (1.62%) Cloud Native
8 16 (1.52%) Taxonomies
9 8 (0.76%) Legacy Systems
9 8 (0.76%) Pricing Data
10 7 (0.67%) FMCG
10 7 (0.67%) Housing Association
10 7 (0.67%) Low-Code
10 7 (0.67%) Mainframe
10 7 (0.67%) Renewable Energy
11 6 (0.57%) Distributed Systems
12 5 (0.48%) Credit Risk
12 5 (0.48%) Driving Licence
12 5 (0.48%) SCADA
Operating Systems
1 20 (1.90%) Windows
2 13 (1.24%) Linux
3 8 (0.76%) Unix
4 1 (0.095%) Ubuntu
4 1 (0.095%) Windows Server
Processes & Methodologies
1 595 (56.61%) Analytics
2 350 (33.30%) Continuous Improvement
3 316 (30.07%) ERP
4 249 (23.69%) Data Modelling
5 244 (23.22%) Agile
6 183 (17.41%) Data Governance
7 151 (14.37%) Problem-Solving
8 149 (14.18%) Business Intelligence
9 146 (13.89%) Data Integration
10 142 (13.51%) DevOps
11 141 (13.42%) Stakeholder Management
12 133 (12.65%) Data Analysis
13 121 (11.51%) Data Analytics
14 119 (11.32%) Service Management
15 110 (10.47%) Decision-Making
16 106 (10.09%) Computer Science
16 106 (10.09%) Data Architecture
17 105 (9.99%) Data Engineering
18 101 (9.61%) ITIL
19 97 (9.23%) Customer Experience
Programming Languages
1 176 (16.75%) SQL
2 87 (8.28%) Python
3 24 (2.28%) C#
3 24 (2.28%) Java
4 21 (2.00%) Apex Code
5 18 (1.71%) VBA
6 12 (1.14%) JavaScript
7 9 (0.86%) R
7 9 (0.86%) T-SQL
8 8 (0.76%) PL/SQL
8 8 (0.76%) Shell Script
9 5 (0.48%) TypeScript
10 3 (0.29%) Clojure
10 3 (0.29%) VB
10 3 (0.29%) X++
11 2 (0.19%) Data Analysis Expressions
11 2 (0.19%) MATLAB
11 2 (0.19%) PHP
11 2 (0.19%) Scala
11 2 (0.19%) SPARQL
Qualifications
1 236 (22.45%) Degree
2 95 (9.04%) DBS Check
3 31 (2.95%) Computer Science Degree
4 28 (2.66%) Master's Degree
4 28 (2.66%) Security Cleared
5 19 (1.81%) PMI Certification
5 19 (1.81%) PMP
6 18 (1.71%) BPSS Clearance
7 16 (1.52%) SC Cleared
8 12 (1.14%) Azure Certification
9 9 (0.86%) AWS Certification
9 9 (0.86%) AWS Certified Solutions Architect
10 8 (0.76%) HNC
10 8 (0.76%) HND
11 7 (0.67%) Microsoft Certification
11 7 (0.67%) MRICS
12 6 (0.57%) DV Cleared
13 5 (0.48%) CISSP
13 5 (0.48%) CITP
13 5 (0.48%) MBA
Quality Assurance & Compliance
1 262 (24.93%) Data Quality
2 63 (5.99%) QA
3 61 (5.80%) GDPR
4 58 (5.52%) Accessibility
5 7 (0.67%) NIST
5 7 (0.67%) PCI DSS
6 6 (0.57%) California Consumer Privacy Act
6 6 (0.57%) ISO/IEC 27001
7 5 (0.48%) HIPAA
7 5 (0.48%) SLA
8 4 (0.38%) Actionable Recommendations
8 4 (0.38%) Basel II
8 4 (0.38%) Basel III
8 4 (0.38%) Dodd-Frank
8 4 (0.38%) IFRS
8 4 (0.38%) IFRS 9
9 3 (0.29%) PMO
10 2 (0.19%) Dublin Core
10 2 (0.19%) ITGC
System Software
1 18 (1.71%) Docker
2 5 (0.48%) VMware Infrastructure
3 2 (0.19%) Active Directory
4 1 (0.095%) GPFS
4 1 (0.095%) Lustre
4 1 (0.095%) NFS
4 1 (0.095%) Virtual Servers
Systems Management
1 16 (1.52%) Kubernetes
2 6 (0.57%) Terraform
3 5 (0.48%) Grafana
3 5 (0.48%) Oracle RMAN
3 5 (0.48%) Prometheus
4 4 (0.38%) Ansible
5 2 (0.19%) Kibana
6 1 (0.095%) Active Directory Federation Services
Vendors
1 223 (21.22%) Microsoft
2 109 (10.37%) Oracle
3 71 (6.76%) SAP
4 42 (4.00%) Salesforce
5 36 (3.43%) ServiceNow
6 23 (2.19%) Google
7 21 (2.00%) Salesforce Marketing Cloud
8 20 (1.90%) Informatica
9 18 (1.71%) Facebook
10 17 (1.62%) Commvault
11 14 (1.33%) Databricks
12 10 (0.95%) Workday
13 6 (0.57%) Talend
14 5 (0.48%) Adobe
14 5 (0.48%) Intapp
14 5 (0.48%) PeopleSoft
14 5 (0.48%) VMware
15 4 (0.38%) BiZZdesign
15 4 (0.38%) Black Duck
15 4 (0.38%) UiPath