Elasticsearch Jobs in the UK excluding London

Elastic Elasticsearch
UK > UK excluding London

The following table provides summary statistics for permanent job vacancies advertised in the UK excluding London with a requirement for Elasticsearch skills. Included is a benchmarking guide to the salaries offered in vacancies that have cited Elasticsearch over the 6 months to 26 April 2024 with a comparison to the same period in the previous 2 years.

6 months to
26 Apr 2024
Same period 2023 Same period 2022
Rank 300 441 320
Rank change year-on-year +141 -121 -26
Permanent jobs citing Elasticsearch 613 338 724
As % of all permanent jobs advertised in the UK excluding London 0.87% 0.55% 1.03%
As % of the Database & Business Intelligence category 4.97% 2.78% 4.48%
Number of salaries quoted 341 197 375
10th Percentile £35,000 £40,000 £40,000
25th Percentile £43,750 £49,500 £46,250
Median annual salary (50th Percentile) £55,000 £65,000 £60,000
Median % change year-on-year -15.38% +8.33% +9.09%
75th Percentile £72,500 £78,750 £77,500
90th Percentile £86,485 £89,250 £90,000
UK median annual salary £60,000 £71,000 £70,000
% change year-on-year -15.49% +1.43% +16.67%

All Database and Business Intelligence Skills
UK excluding London

Elasticsearch is in the Databases and Business Intelligence category. The following table is for comparison with the above and provides summary statistics for all permanent job vacancies advertised in the UK excluding London with a requirement for database or business intelligence skills.

Permanent vacancies with a requirement for database or business intelligence skills 12,335 12,151 16,145
As % of all permanent jobs advertised in the UK excluding London 17.59% 19.65% 22.87%
Number of salaries quoted 8,221 7,036 10,444
10th Percentile £32,000 £34,500 £32,500
25th Percentile £41,250 £41,250 £40,000
Median annual salary (50th Percentile) £52,500 £55,000 £52,106
Median % change year-on-year -4.55% +5.56% +6.88%
75th Percentile £65,000 £70,000 £65,000
90th Percentile £80,000 £82,500 £80,000
UK median annual salary £57,500 £65,000 £60,000
% change year-on-year -11.54% +8.33% +9.09%

Elasticsearch
Job Vacancy Trend in the UK excluding London

Job postings citing Elasticsearch as a proportion of all IT jobs advertised in the UK excluding London.
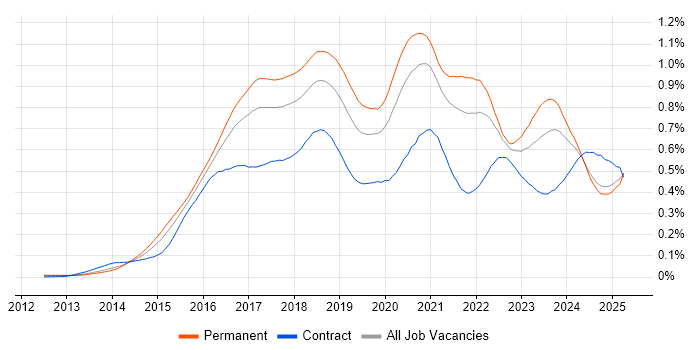
Job vacancy trend for Elasticsearch in the UK excluding London

Elasticsearch
Salary Trend in the UK excluding London

3-month moving average salary quoted in jobs citing Elasticsearch in the UK excluding London.

Salary trend for Elasticsearch in the UK excluding London

Elasticsearch
Salary Histogram in the UK excluding London

Salary distribution for jobs citing Elasticsearch in the UK excluding London over the 6 months to 26 April 2024.

Salary histogram for Elasticsearch in the UK excluding London

Elasticsearch
Job Locations in the UK excluding London

The table below looks at the demand and provides a guide to the median salaries quoted in IT jobs citing Elasticsearch within the UK excluding London region over the 6 months to 26 April 2024. The 'Rank Change' column provides an indication of the change in demand within each location based on the same 6 month period last year.

Location Rank Change
on Same Period
Last Year
Matching
Permanent
IT Job Ads
Median Salary
Past 6 Months
Median Salary
% Change
on Same Period
Last Year
Live
Jobs
Scotland +94 189 £55,000 - 5
South East +30 134 £57,500 -8.00% 33
North of England +71 93 £47,500 -20.83% 21
Midlands +80 82 £52,500 -16.00% 19
West Midlands +84 59 £55,000 -7.56% 13
North West +8 49 £40,000 -33.33% 12
East of England +47 48 £55,500 -14.62% 8
Yorkshire +117 37 £55,000 -4.35% 8
South West -55 37 £57,500 -20.14% 10
East Midlands +3 26 £52,500 -16.00% 6
Wales +10 24 £50,998 -19.24% 5
Northern Ireland +24 9 £85,000 - 3
North East +7 9 £47,500 -38.71% 1
Elasticsearch
UK

Elasticsearch
Co-occurring Skills and Capabilities in the UK excluding London by Category

The follow tables expand on the table above by listing co-occurrences grouped by category. The same employment type, locality and period is covered with up to 20 co-occurrences shown in each of the following categories:

Application Platforms
1 96 (15.66%) FileNet
2 66 (10.77%) Apache
3 29 (4.73%) WebLogic
4 26 (4.24%) Apache Spark
5 14 (2.28%) Cloud Foundry
5 14 (2.28%) Microsoft Exchange
6 6 (0.98%) Apache Solr
6 6 (0.98%) nginx
7 5 (0.82%) CMS
7 5 (0.82%) IIS
8 4 (0.65%) Drupal
9 3 (0.49%) Confluence
9 3 (0.49%) WordPress
10 2 (0.33%) Umbraco
11 1 (0.16%) ColdFusion
11 1 (0.16%) DNN
11 1 (0.16%) EPiServer
11 1 (0.16%) Immediacy CMS
11 1 (0.16%) Kentico
11 1 (0.16%) Sitecore CMS
Cloud Services
1 284 (46.33%) AWS
2 278 (45.35%) Azure
3 169 (27.57%) Amazon S3
4 57 (9.30%) GitHub
5 51 (8.32%) SaaS
6 47 (7.67%) GCP
7 39 (6.36%) Snowflake
8 31 (5.06%) Azure Cosmos DB
9 30 (4.89%) Matillion
10 24 (3.92%) Slack
11 23 (3.75%) Amazon SQS
11 23 (3.75%) Google Docs
11 23 (3.75%) Lucidchart
11 23 (3.75%) Miro
12 16 (2.61%) Azure DevOps
13 13 (2.12%) OpenShift
14 12 (1.96%) Cloud Computing
15 8 (1.31%) Azure AKS
16 6 (0.98%) IaaS
16 6 (0.98%) PaaS
Communications & Networking
1 65 (10.60%) Internet
2 55 (8.97%) Firewall
2 55 (8.97%) VPN
3 49 (7.99%) IPsec
3 49 (7.99%) SNMP
4 16 (2.61%) Hyperconnected
5 8 (1.31%) DNS
6 5 (0.82%) DHCP
6 5 (0.82%) Network Security
6 5 (0.82%) TCP/IP
7 3 (0.49%) BGP
7 3 (0.49%) SAN
8 1 (0.16%) IPv4
8 1 (0.16%) OSPF
8 1 (0.16%) VLAN
Database & Business Intelligence
1 303 (49.43%) MongoDB
2 251 (40.95%) SQL Server
3 125 (20.39%) NoSQL
4 99 (16.15%) Apache Cassandra
5 56 (9.14%) Redis
6 42 (6.85%) Relational Database
7 33 (5.38%) Data Warehouse
8 30 (4.89%) Data Lake
8 30 (4.89%) MySQL
8 30 (4.89%) Star Schema
9 26 (4.24%) Big Data
10 24 (3.92%) Hadoop
11 23 (3.75%) Scylla
12 21 (3.43%) PostgreSQL
13 11 (1.79%) CouchDB
14 7 (1.14%) MariaDB
14 7 (1.14%) RDBMS
15 5 (0.82%) Amazon RDS
16 3 (0.49%) Amazon Redshift
16 3 (0.49%) Azure SQL Data Warehouse
Development Applications
1 101 (16.48%) JUnit
2 73 (11.91%) Jenkins
3 46 (7.50%) Mockito
4 44 (7.18%) Jasmine
5 41 (6.69%) Git
6 38 (6.20%) GitLab
7 30 (4.89%) Cucumber
8 29 (4.73%) Cypress.io
9 18 (2.94%) JIRA
10 14 (2.28%) Selenium
11 8 (1.31%) Gradle
12 7 (1.14%) Moq
13 6 (0.98%) Maven
13 6 (0.98%) Trac
14 5 (0.82%) Octopus Deploy
15 4 (0.65%) Artifactory
15 4 (0.65%) SonarQube
16 2 (0.33%) Burp Suite
16 2 (0.33%) WebDriver
16 2 (0.33%) webpack
General
1 246 (40.13%) Finance
2 167 (27.24%) Inclusion and Diversity
3 147 (23.98%) Law
4 70 (11.42%) Social Skills
5 62 (10.11%) Marketing
6 45 (7.34%) Legal
7 41 (6.69%) Analytical Skills
8 26 (4.24%) Police
8 26 (4.24%) Retail
9 21 (3.43%) Banking
10 14 (2.28%) Investment Banking
11 13 (2.12%) Games
12 7 (1.14%) Private Banking
12 7 (1.14%) Publishing
13 6 (0.98%) Automotive
13 6 (0.98%) Manufacturing
14 5 (0.82%) Organisational Skills
15 3 (0.49%) Financial Institution
16 2 (0.33%) German Language
16 2 (0.33%) Influencing Skills
Job Titles
1 242 (39.48%) Developer
2 205 (33.44%) Software Engineer
3 194 (31.65%) .NET Developer
4 88 (14.36%) Senior
5 86 (14.03%) Java Engineer
6 85 (13.87%) Java Software Engineer
7 77 (12.56%) Lead
8 74 (12.07%) Full Stack Engineer
9 73 (11.91%) Full Stack Software Engineer
9 73 (11.91%) Lead Software Engineer
10 54 (8.81%) C# Developer
11 53 (8.65%) C# .NET Developer
12 50 (8.16%) Consultant
13 49 (7.99%) NetApp Consultant
14 35 (5.71%) Lead Java Engineer
15 33 (5.38%) Senior Software Engineer
16 31 (5.06%) Data Engineer
17 29 (4.73%) Applications Support Analyst
17 29 (4.73%) Senior Applications Support
17 29 (4.73%) Senior Support Analyst
Libraries, Frameworks & Software Standards
1 346 (56.44%) React
2 335 (54.65%) AngularJS
3 264 (43.07%) Node.js
4 231 (37.68%) .NET
5 201 (32.79%) .NET Core
6 198 (32.30%) ASP.NET
7 197 (32.14%) .NET Framework
8 195 (31.81%) Vue
9 194 (31.65%) Entity Framework
10 193 (31.48%) ASP.NET Web API
11 189 (30.83%) ASP.NET MVC
12 176 (28.71%) Spring
13 171 (27.90%) Kafka
14 150 (24.47%) J2EE
15 122 (19.90%) GraphQL
16 107 (17.46%) Hibernate
17 96 (15.66%) Spring Integration
18 95 (15.50%) CSS
19 93 (15.17%) HTML
20 67 (10.93%) RabbitMQ
Miscellaneous
1 110 (17.94%) Cloud Native
2 58 (9.46%) Algorithms
3 55 (8.97%) Data Centre
4 54 (8.81%) Data Structures
5 32 (5.22%) Self-Motivation
6 27 (4.40%) Greenfield Project
7 19 (3.10%) Management Information System
8 17 (2.77%) Private Cloud
9 8 (1.31%) Client/Server
9 8 (1.31%) PropTech
9 8 (1.31%) Public Cloud
10 4 (0.65%) Product Ownership
11 3 (0.49%) Blockchain
11 3 (0.49%) Clustering
11 3 (0.49%) Enterprise Software
11 3 (0.49%) Linux Command Line
11 3 (0.49%) PKI
12 2 (0.33%) Onboarding
13 1 (0.16%) Legacy Code
13 1 (0.16%) Legacy Systems
Operating Systems
1 84 (13.70%) Linux
2 66 (10.77%) Windows
3 49 (7.99%) Data ONTAP
4 33 (5.38%) Unix
5 4 (0.65%) Windows Server
6 2 (0.33%) Ubuntu
7 1 (0.16%) Mac OS
7 1 (0.16%) Red Hat Enterprise Linux
Processes & Methodologies
1 397 (64.76%) Agile
2 330 (53.83%) Microservices
3 272 (44.37%) Full Stack Development
4 225 (36.70%) Software Engineering
5 223 (36.38%) TDD
6 205 (33.44%) CI/CD
6 205 (33.44%) Scrum
7 204 (33.28%) MVC
8 186 (30.34%) BDD
8 186 (30.34%) Kanban
8 186 (30.34%) Problem-Solving
9 142 (23.16%) Artificial Intelligence
10 136 (22.19%) SDLC
11 134 (21.86%) Machine Learning
12 96 (15.66%) AOP
12 96 (15.66%) Document Management
13 89 (14.52%) DevOps
14 84 (13.70%) Actionable Insight
14 84 (13.70%) Operational Stability
15 72 (11.75%) Decision-Making
Programming Languages
1 302 (49.27%) JavaScript
2 266 (43.39%) TypeScript
3 232 (37.85%) Java
4 228 (37.19%) SQL
5 225 (36.70%) C#
6 161 (26.26%) Python
7 34 (5.55%) Go
8 30 (4.89%) Shell Script
9 25 (4.08%) Bash
10 24 (3.92%) Scala
11 12 (1.96%) PHP
12 10 (1.63%) C++
13 7 (1.14%) T-SQL
14 5 (0.82%) Bicep
14 5 (0.82%) PowerShell
15 4 (0.65%) VB
16 3 (0.49%) Perl
17 2 (0.33%) Kotlin
18 1 (0.16%) R
18 1 (0.16%) Rust
Qualifications
1 51 (8.32%) Degree
2 49 (7.99%) Security Cleared
3 45 (7.34%) SC Cleared
4 38 (6.20%) Computer Science Degree
5 32 (5.22%) Master's Degree
6 7 (1.14%) DV Cleared
7 6 (0.98%) Azure Certification
8 5 (0.82%) CISSP
8 5 (0.82%) Microsoft Certification
8 5 (0.82%) TOGAF Certification
9 2 (0.33%) BPSS Clearance
9 2 (0.33%) PhD
10 1 (0.16%) Numerate Degree
Quality Assurance & Compliance
1 30 (4.89%) Data Quality
2 29 (4.73%) SLA
3 12 (1.96%) QA
4 3 (0.49%) Accessibility
5 1 (0.16%) Disclosure Scotland
5 1 (0.16%) ISO 9001
5 1 (0.16%) WCAG
System Software
1 130 (21.21%) Docker
2 53 (8.65%) VMware Infrastructure
3 14 (2.28%) Active Directory
4 5 (0.82%) Hyper-V
5 3 (0.49%) VMware Server
6 2 (0.33%) Varnish
Systems Management
1 240 (39.15%) Kubernetes
2 66 (10.77%) Ansible
3 56 (9.14%) Prometheus
4 49 (7.99%) vCenter Server
5 31 (5.06%) Single Sign-On
5 31 (5.06%) Terraform
6 29 (4.73%) OpenSSO
7 15 (2.45%) Kibana
8 9 (1.47%) Grafana
9 8 (1.31%) SCOM
10 3 (0.49%) Kustomize
10 3 (0.49%) SCOrch
10 3 (0.49%) vMotion
11 2 (0.33%) logstash
11 2 (0.33%) Puppet
Vendors
1 209 (34.09%) Microsoft
2 158 (25.77%) Oracle
3 53 (8.65%) VMware
4 49 (7.99%) NetApp
4 49 (7.99%) Palo Alto
4 49 (7.99%) Red Hat
4 49 (7.99%) SolidFire
5 35 (5.71%) Google
6 29 (4.73%) Remedy
7 23 (3.75%) Dell
8 6 (0.98%) Splunk
9 5 (0.82%) SolarWinds
10 3 (0.49%) AppDynamics
11 2 (0.33%) Databricks
12 1 (0.16%) Alterian
12 1 (0.16%) Dataiku
12 1 (0.16%) ESRI
12 1 (0.16%) Sitecore
12 1 (0.16%) WooCommerce