Innovative Thinking Jobs in the UK excluding London

Innovative Thinking
UK > UK excluding London

The table below provides summary statistics for permanent job vacancies advertised in the UK excluding London requiring Innovative Thinking skills. It includes a benchmarking guide to the annual salaries offered in vacancies that cited Innovative Thinking over the 6 months leading up to 30 May 2025, comparing them to the same period in the previous two years.

6 months to
30 May 2025
Same period 2024 Same period 2023
Rank 313 377 414
Rank change year-on-year +64 +37 -97
Permanent jobs citing Innovative Thinking 303 471 392
As % of all permanent jobs advertised in the UK excluding London 0.77% 0.63% 0.68%
As % of the Processes & Methodologies category 0.83% 0.77% 0.71%
Number of salaries quoted 44 286 130
10th Percentile £27,000 £27,500 £29,000
25th Percentile £31,250 £37,000 £31,250
Median annual salary (50th Percentile) £55,000 £52,084 £47,555
Median % change year-on-year +5.60% +9.52% +7.71%
75th Percentile £60,000 £62,500 £63,750
90th Percentile £63,925 £77,500 £81,625
UK median annual salary £59,500 £55,000 £65,000
% change year-on-year +8.18% -15.38% +23.81%

All Process and Methodology Skills
UK excluding London

Innovative Thinking falls under the Processes and Methodologies category. For comparison with the information above, the following table provides summary statistics for all permanent job vacancies requiring process or methodology skills in the UK excluding London.

Permanent vacancies with a requirement for process or methodology skills 36,483 61,419 55,450
As % of all permanent jobs advertised in the UK excluding London 92.65% 82.37% 95.58%
Number of salaries quoted 17,392 42,187 28,711
10th Percentile £26,250 £27,250 £30,500
25th Percentile £36,750 £36,250 £40,000
Median annual salary (50th Percentile) £51,574 £50,000 £55,000
Median % change year-on-year +3.15% -9.09% +4.76%
75th Percentile £65,000 £65,000 £70,000
90th Percentile £77,500 £77,500 £82,500
UK median annual salary £57,443 £55,000 £60,899
% change year-on-year +4.44% -9.69% +1.50%

Innovative Thinking
Job Vacancy Trend in the UK excluding London

Job postings citing Innovative Thinking as a proportion of all IT jobs advertised in the UK excluding London.
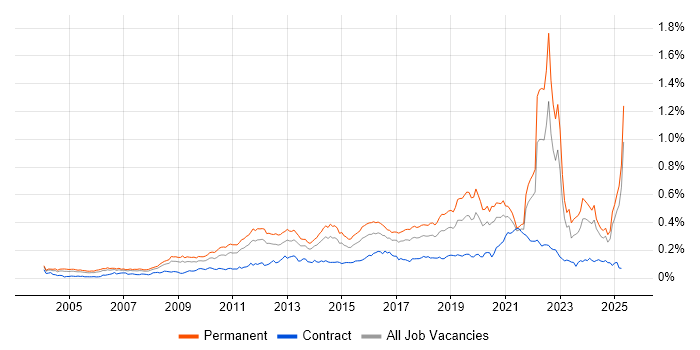
Job vacancy trend for Innovative Thinking in the UK excluding London

Innovative Thinking
Salary Trend in the UK excluding London

3-month moving average salary quoted in jobs citing Innovative Thinking in the UK excluding London.

Salary trend for Innovative Thinking in the UK excluding London

Innovative Thinking
Salary Histogram in the UK excluding London

Salary distribution for jobs citing Innovative Thinking in the UK excluding London over the 6 months to 30 May 2025.

Salary histogram for Innovative Thinking in the UK excluding London

Innovative Thinking
Job Locations in the UK excluding London

The table below looks at the demand and provides a guide to the median salaries quoted in IT jobs citing Innovative Thinking within the UK excluding London region over the 6 months to 30 May 2025. The 'Rank Change' column provides an indication of the change in demand within each location based on the same 6 month period last year.

Location Rank Change
on Same Period
Last Year
Matching
Permanent
IT Job Ads
Median Salary
Past 6 Months
Median Salary
% Change
on Same Period
Last Year
Live
Jobs
South East +109 126 £43,750 +9.38% 120
North of England -20 49 £75,000 +47.06% 69
North West -10 47 - - 38
South West +38 45 £54,282 -9.53% 44
Northern Ireland +62 38 £55,000 -3.97% 4
East of England +33 16 £55,000 +89.66% 48
Scotland +109 10 - - 10
Wales +56 10 - - 11
Midlands +23 8 £40,500 -19.00% 63
West Midlands +19 5 £37,500 -31.82% 32
East Midlands +22 3 £62,500 +25.00% 27
Yorkshire +23 2 £75,000 +61.44% 25
Channel Islands - 1 £45,000 -
Innovative Thinking
UK

Innovative Thinking
Co-occurring Skills and Capabilities in the UK excluding London by Category

The follow tables expand on the table above by listing co-occurrences grouped by category. The same employment type, locality and period is covered with up to 20 co-occurrences shown in each of the following categories:

Application Platforms
1 22 (7.26%) IBM Domino
2 12 (3.96%) Microsoft Exchange
3 5 (1.65%) nginx
3 5 (1.65%) Tomcat
4 2 (0.66%) Adobe Experience Manager
4 2 (0.66%) CMS
4 2 (0.66%) Confluence
5 1 (0.33%) SharePoint
Applications
1 4 (1.32%) Simulink
2 2 (0.66%) Adobe After Effects
2 2 (0.66%) Adobe Creative Suite
2 2 (0.66%) Adobe Illustrator
2 2 (0.66%) InDesign
2 2 (0.66%) Microsoft Excel
2 2 (0.66%) Photoshop
3 1 (0.33%) Microsoft Office
Business Applications
1 15 (4.95%) Sparx Enterprise Architect
2 12 (3.96%) SAP S/4HANA
3 7 (2.31%) Q-Pulse
4 6 (1.98%) Remedy ITSM
5 5 (1.65%) Maximo
Cloud Services
1 40 (13.20%) Azure
2 15 (4.95%) AWS
3 11 (3.63%) Microsoft 365
4 8 (2.64%) Google Workspace
5 5 (1.65%) Amazon ElastiCache
5 5 (1.65%) Amazon OpenSearch
5 5 (1.65%) Amazon SQS
5 5 (1.65%) IaaS
6 4 (1.32%) SaaS
7 3 (0.99%) BrowserStack
7 3 (0.99%) Sauce Labs
8 2 (0.66%) Adobe Analytics
8 2 (0.66%) Contentsquare
8 2 (0.66%) Figma
8 2 (0.66%) Google Analytics
8 2 (0.66%) Power Platform
9 1 (0.33%) Amazon SageMaker
9 1 (0.33%) Azure Data Factory
9 1 (0.33%) Power Automate
9 1 (0.33%) PowerApps
Communications & Networking
1 38 (12.54%) Software-Defined Radio
2 18 (5.94%) ATM
2 18 (5.94%) VoIP
2 18 (5.94%) Wireless
3 9 (2.97%) WAN
4 8 (2.64%) 5G
4 8 (2.64%) SD-WAN
5 7 (2.31%) VLAN
6 6 (1.98%) SAN
6 6 (1.98%) Wi-Fi
7 3 (0.99%) DHCP
7 3 (0.99%) DNS
8 1 (0.33%) 3G
8 1 (0.33%) EIGRP
8 1 (0.33%) Firewall
8 1 (0.33%) LTE
8 1 (0.33%) Modbus
8 1 (0.33%) Network Security
8 1 (0.33%) OSPF
8 1 (0.33%) TCP/IP
Database & Business Intelligence
1 30 (9.90%) Data Lake
2 12 (3.96%) SAP HANA
3 7 (2.31%) Elasticsearch
4 6 (1.98%) PostgreSQL
5 5 (1.65%) Amazon Aurora
5 5 (1.65%) Amazon RDS
6 2 (0.66%) MySQL
6 2 (0.66%) Power BI
6 2 (0.66%) Redis
7 1 (0.33%) Data Warehouse
7 1 (0.33%) DynamoDB
7 1 (0.33%) NoSQL
7 1 (0.33%) SQL Server Integration Services
7 1 (0.33%) SQL Server Reporting Services
7 1 (0.33%) TimescaleDB
Development Applications
1 13 (4.29%) JIRA
2 6 (1.98%) Jenkins
3 5 (1.65%) Bitbucket
3 5 (1.65%) Cucumber
3 5 (1.65%) JUnit
3 5 (1.65%) Maven
3 5 (1.65%) Mockito
3 5 (1.65%) Postman
3 5 (1.65%) Selenium
3 5 (1.65%) SonarQube
3 5 (1.65%) TestNG
4 3 (0.99%) Appium
General
1 99 (32.67%) Finance
2 93 (30.69%) Analytical Skills
2 93 (30.69%) Social Skills
3 43 (14.19%) Influencing Skills
4 33 (10.89%) Manufacturing
5 31 (10.23%) Law
6 28 (9.24%) Military
7 20 (6.60%) Public Sector
8 16 (5.28%) Aerospace
9 12 (3.96%) Electronics
10 11 (3.63%) Organisational Skills
11 10 (3.30%) Marketing
12 8 (2.64%) Presentation Skills
13 7 (2.31%) Automotive
13 7 (2.31%) Aviation
14 4 (1.32%) Legal
15 3 (0.99%) Police
16 2 (0.66%) French Language
16 2 (0.66%) German Language
16 2 (0.66%) Retail
Job Titles
1 46 (15.18%) Systems Engineer
2 44 (14.52%) Senior
3 24 (7.92%) Software Engineer
4 22 (7.26%) Project Manager
4 22 (7.26%) Quality Manager
5 21 (6.93%) QA Manager
6 20 (6.60%) Delivery Project Manager
7 18 (5.94%) Field Engineer
7 18 (5.94%) Field Service Engineer
7 18 (5.94%) Lead
7 18 (5.94%) Radio Engineer
8 17 (5.61%) Embedded Engineer
8 17 (5.61%) Embedded Software Engineer
9 15 (4.95%) Administrator
9 15 (4.95%) Systems Administrator
10 12 (3.96%) Supplier Manager
11 11 (3.63%) FPGA Engineer
11 11 (3.63%) IT Support
12 9 (2.97%) 2nd Line Support
12 9 (2.97%) FPGA Design Engineer
Libraries, Frameworks & Software Standards
1 7 (2.31%) REST
1 7 (2.31%) XML
2 5 (1.65%) Elastic Stack
2 5 (1.65%) Gherkin
2 5 (1.65%) Guice
2 5 (1.65%) JAX-RS
2 5 (1.65%) Kafka
2 5 (1.65%) Mustache
2 5 (1.65%) OpenAPI
2 5 (1.65%) RESTful
2 5 (1.65%) SAML
2 5 (1.65%) SAP Fiori
2 5 (1.65%) SAPUI5
2 5 (1.65%) Spring
2 5 (1.65%) Spring Boot
2 5 (1.65%) Swagger
2 5 (1.65%) WireMock
3 4 (1.32%) .NET
4 3 (0.99%) Playwright
5 2 (0.66%) FastAPI
Miscellaneous
1 81 (26.73%) e-Learning
2 32 (10.56%) FPGA
3 31 (10.23%) Analytical Mindset
4 19 (6.27%) Driving Licence
4 19 (6.27%) MicroBlaze
5 18 (5.94%) Management Information System
6 17 (5.61%) Embedded Systems
6 17 (5.61%) RISC-V
7 14 (4.62%) Self-Motivation
8 8 (2.64%) Operational Technology
8 8 (2.64%) Self-Driving Car
9 7 (2.31%) Reference Data
9 7 (2.31%) Smartphone
10 6 (1.98%) Fibre Optics
10 6 (1.98%) Product Ownership
11 5 (1.65%) Life Science
11 5 (1.65%) PKI
12 2 (0.66%) Animation
12 2 (0.66%) VHDL
12 2 (0.66%) Video Editing
Operating Systems
1 42 (13.86%) Linux
2 19 (6.27%) Windows
3 17 (5.61%) Embedded Linux
4 10 (3.30%) Windows Server
5 1 (0.33%) Mac OS
5 1 (0.33%) Unix
5 1 (0.33%) Windows 10
5 1 (0.33%) Windows Server 2012
5 1 (0.33%) Windows Server 2016
5 1 (0.33%) Windows Server 2019
Processes & Methodologies
1 93 (30.69%) Problem-Solving
2 84 (27.72%) Agile
3 64 (21.12%) Project Management
4 47 (15.51%) Roadmaps
5 40 (13.20%) Signal Processing
6 38 (12.54%) Analytics
6 38 (12.54%) Digital Signal Processing
7 34 (11.22%) Strategic Roadmap
8 33 (10.89%) Machine Learning
8 33 (10.89%) Software Engineering
9 32 (10.56%) Actionable Insight
9 32 (10.56%) Data Science
9 32 (10.56%) Stakeholder Management
10 31 (10.23%) Cybersecurity
11 30 (9.90%) Co-Creation
11 30 (9.90%) People Analytics
11 30 (9.90%) Predictive Modelling
11 30 (9.90%) Scorecard
11 30 (9.90%) Thought Leadership
12 29 (9.57%) Project Delivery
Programming Languages
1 24 (7.92%) MATLAB
2 21 (6.93%) C++
3 20 (6.60%) C
4 12 (3.96%) Python
5 11 (3.63%) SQL
6 10 (3.30%) Java
7 7 (2.31%) PL/SQL
8 6 (1.98%) Perl
9 5 (1.65%) JavaScript
9 5 (1.65%) PHP
10 3 (0.99%) Tcl
11 2 (0.66%) C#
11 2 (0.66%) VB
12 1 (0.33%) Bash
12 1 (0.33%) Data Analysis Expressions
12 1 (0.33%) PowerShell
12 1 (0.33%) Shell Script
Qualifications
1 119 (39.27%) Security Cleared
2 102 (33.66%) SC Cleared
3 60 (19.80%) Degree
4 28 (9.24%) BPSS Clearance
5 22 (7.26%) DV Cleared
6 20 (6.60%) CCNP
6 20 (6.60%) Cisco Certification
7 15 (4.95%) RHCSA
8 7 (2.31%) Computer Science Degree
8 7 (2.31%) Master's Degree
9 5 (1.65%) Azure Certification
9 5 (1.65%) CCNA
9 5 (1.65%) VMware Certified Professional (VCP)
10 3 (0.99%) PhD
11 1 (0.33%) Microsoft Certification
Quality Assurance & Compliance
1 24 (7.92%) QA
2 9 (2.97%) PMO
3 7 (2.31%) Data Quality
4 6 (1.98%) GDPR
5 5 (1.65%) SLA
6 2 (0.66%) ISO/IEC 27001
7 1 (0.33%) Actionable Recommendations
7 1 (0.33%) AQAP
7 1 (0.33%) Government Security Classifications
7 1 (0.33%) ISO 9001
7 1 (0.33%) Software Quality Assurance
System Software
1 40 (13.20%) Firmware
2 37 (12.21%) Embedded Firmware
3 8 (2.64%) Active Directory
4 6 (1.98%) Docker
4 6 (1.98%) Hyper-V
4 6 (1.98%) VMware ESXi
5 2 (0.66%) VMware Infrastructure
6 1 (0.33%) Virtual Desktop
6 1 (0.33%) VMware NSX
Systems Management
1 8 (2.64%) Ansible
2 6 (1.98%) Kubernetes
3 5 (1.65%) Kustomize
3 5 (1.65%) Packer
3 5 (1.65%) Single Sign-On
3 5 (1.65%) Terraform
4 2 (0.66%) Grafana
4 2 (0.66%) Prometheus
5 1 (0.33%) Avamar
5 1 (0.33%) Backup Exec
5 1 (0.33%) Progress Chef
5 1 (0.33%) Puppet
5 1 (0.33%) vCenter Server
5 1 (0.33%) VxRail
Vendors
1 20 (6.60%) Red Hat
2 16 (5.28%) Cisco
3 15 (4.95%) Sparx
4 13 (4.29%) SAP
5 11 (3.63%) Google
5 11 (3.63%) Microsoft
6 7 (2.31%) IBM
6 7 (2.31%) ServiceNow
6 7 (2.31%) VMware
7 6 (1.98%) BMC
7 6 (1.98%) Remedy
8 5 (1.65%) Veeam
8 5 (1.65%) Xilinx
9 4 (1.32%) Adobe
10 2 (0.66%) Altera
10 2 (0.66%) Green Hills
11 1 (0.33%) Aruba
11 1 (0.33%) Dell
11 1 (0.33%) Nimble Storage
11 1 (0.33%) NVIDIA