Azure Stack Job Trends

Microsoft Azure Stack
UK

The table below provides summary statistics and salary benchmarking for jobs requiring Azure Stack skills. It covers permanent job vacancies from the 6 months leading up to 1 November 2025, with comparisons to the same periods in the previous two years.

6 months to
1 Nov 2025
Same period 2024 Same period 2023
Rank 636 678 678
Rank change year-on-year +42 0 +300
Permanent jobs citing Azure Stack 40 64 62
As % of all permanent jobs in the UK 0.079% 0.094% 0.11%
As % of the Cloud Services category 0.25% 0.29% 0.27%
Number of salaries quoted 37 43 45
10th Percentile £50,350 £48,200 £36,250
25th Percentile £61,250 £51,000 £55,000
Median annual salary (50th Percentile) £69,000 £65,000 £63,096
Median % change year-on-year +6.15% +3.02% -8.42%
75th Percentile £80,000 £85,750 £72,500
90th Percentile £87,200 £100,750 £115,000
UK excluding London median annual salary £77,500 £57,500 £65,000
% change year-on-year +34.78% -11.54% -3.70%

All Cloud Skills
UK

Azure Stack falls under the Cloud Services category. For comparison with the information above, the following table provides summary statistics for all permanent job vacancies requiring cloud computing skills.

Permanent vacancies with a requirement for cloud computing skills 16,055 21,992 23,258
As % of all permanent jobs advertised in the UK 31.85% 32.35% 42.92%
Number of salaries quoted 10,834 13,307 19,492
10th Percentile £28,697 £35,000 £32,766
25th Percentile £37,500 £47,500 £45,000
Median annual salary (50th Percentile) £57,500 £65,000 £62,500
Median % change year-on-year -11.54% +4.00% -
75th Percentile £80,000 £82,500 £82,500
90th Percentile £100,000 £102,500 £100,000
UK excluding London median annual salary £50,000 £55,000 £54,500
% change year-on-year -9.09% +0.92% -0.91%

Azure Stack
Job Vacancy Trend

Historical trend showing the proportion of permanent IT job postings citing Azure Stack relative to all permanent IT jobs advertised.
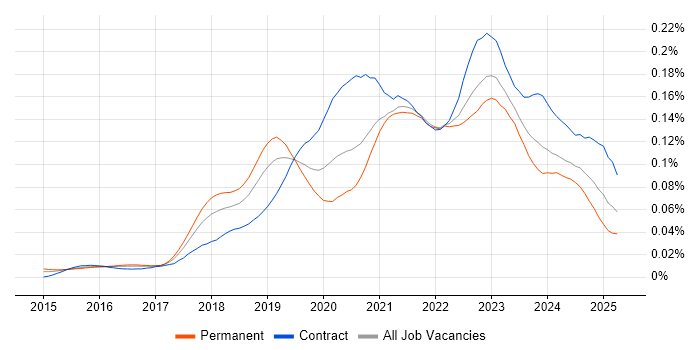
Azure Stack job vacancy trend in the UK

Azure Stack
Salary Trend

Salary distribution trend for jobs in the UK citing Azure Stack.

Salary distribution trend for jobs in the UK citing Azure Stack

Azure Stack
Salary Histogram

Salary distribution for jobs citing Azure Stack over the 6 months to 1 November 2025.

Salary histogram for Azure Stack in the UK

Azure Stack
Top 13 Job Locations

The table below looks at the demand and provides a guide to the median salaries quoted in IT jobs citing Azure Stack within the UK over the 6 months to 1 November 2025. The 'Rank Change' column provides an indication of the change in demand within each location based on the same 6 month period last year.

Location Rank Change
on Same Period
Last Year
Matching
Permanent
IT Job Ads
Median Salary
Past 6 Months
Median Salary
% Change
on Same Period
Last Year
Live
Jobs
England +68 36 £70,000 +7.69% 20
UK excluding London +40 27 £77,500 +34.78% 16
Work from Home +35 20 £80,000 +23.08% 4
South West +42 16 £80,000 +28.00%
Midlands +41 12 £80,000 +42.86% 2
London +36 10 £58,500 -31.18% 10
West Midlands +37 8 £80,000 +33.33% 1
Wales - 8 £80,000 -
North of England +3 6 £67,500 +10.20% 4
East Midlands +10 4 £65,000 +50.59% 1
North East - 4 £67,500 -
North West +9 2 £66,000 +14.78% 4
Scotland -13 1 £87,500 +66.67%

Azure Stack
Co-Occurring Skills & Capabilities by Category

The following tables expand on the one above by listing co-occurrences grouped by category. They cover the same employment type, locality and period, with up to 20 co-occurrences shown in each category:

Application Platforms
1 7 (17.50%) SharePoint
2 2 (5.00%) Apache Spark
Applications
1 4 (10.00%) Chatbot
Cloud Services
1 40 (100.00%) Azure
2 19 (47.50%) Power Platform
3 11 (27.50%) Entra ID
4 9 (22.50%) PaaS
5 8 (20.00%) SaaS
6 7 (17.50%) Azure Data Factory
6 7 (17.50%) IaaS
6 7 (17.50%) Microsoft 365
7 6 (15.00%) Azure DevOps
8 3 (7.50%) GCP
8 3 (7.50%) Microsoft Purview
9 2 (5.00%) Azure Cosmos DB
9 2 (5.00%) Azure Key Vault
9 2 (5.00%) Azure Logic Apps
9 2 (5.00%) Azure Synapse Analytics
10 1 (2.50%) Azure AKS
10 1 (2.50%) Azure Functions
10 1 (2.50%) Azure Monitor
10 1 (2.50%) Serverless
10 1 (2.50%) Snowflake
Communications & Networking
1 2 (5.00%) Firewall
1 2 (5.00%) Network Security
Database & Business Intelligence
1 12 (30.00%) Power BI
2 4 (10.00%) Tableau
3 3 (7.50%) Azure SQL Database
3 3 (7.50%) BigQuery
3 3 (7.50%) Data Lake
4 2 (5.00%) Data Warehouse
4 2 (5.00%) Delta Lake
4 2 (5.00%) Metadata
5 1 (2.50%) Big Data
5 1 (2.50%) Data Mining
5 1 (2.50%) Metabase
5 1 (2.50%) NoSQL
5 1 (2.50%) Spark SQL
5 1 (2.50%) SQL Server
Development Applications
1 2 (5.00%) Git
General
1 12 (30.00%) Public Sector
1 12 (30.00%) Social Skills
2 7 (17.50%) Legal
3 5 (12.50%) Analytical Skills
4 3 (7.50%) Finance
4 3 (7.50%) Manufacturing
5 1 (2.50%) Advertising
5 1 (2.50%) Organisational Skills
Job Titles
1 14 (35.00%) Architect
2 10 (25.00%) Infrastructure Engineer
3 8 (20.00%) Azure Architect
3 8 (20.00%) IT Engineer
3 8 (20.00%) IT Infrastructure Engineer
4 6 (15.00%) Cloud Architect
4 6 (15.00%) Data Engineer
5 5 (12.50%) Senior
6 4 (10.00%) Data Architect
6 4 (10.00%) Infrastructure Technical Architect
6 4 (10.00%) Strategy Architect
6 4 (10.00%) Technical Architect
6 4 (10.00%) Technical Infrastructure Architect
7 3 (7.50%) Analyst
7 3 (7.50%) Analytics Manager
7 3 (7.50%) Cloud Engineer
7 3 (7.50%) Data Analyst
7 3 (7.50%) Quality Analyst
7 3 (7.50%) Senior Analytics Manager
7 3 (7.50%) Senior Manager
Libraries, Frameworks & Software Standards
1 3 (7.50%) PySpark
2 1 (2.50%) .NET
2 1 (2.50%) ARM Templates
2 1 (2.50%) Kafka
Miscellaneous
1 12 (30.00%) Onboarding
2 8 (20.00%) Data Centre
2 8 (20.00%) Hybrid Cloud
3 7 (17.50%) Enterprise Software
4 3 (7.50%) Cloud Native
4 3 (7.50%) Greenfield Project
5 2 (5.00%) Renewable Energy
6 1 (2.50%) EPoS
6 1 (2.50%) Legacy Systems
6 1 (2.50%) Management Information System
Operating Systems
1 14 (35.00%) Windows
2 8 (20.00%) Linux
2 8 (20.00%) Rocky
2 8 (20.00%) Windows Server
2 8 (20.00%) Windows Server 2019
3 2 (5.00%) VMS
Processes & Methodologies
1 12 (30.00%) Business Intelligence
2 10 (25.00%) Analytics
2 10 (25.00%) Infrastructure Engineering
3 9 (22.50%) Data Management
3 9 (22.50%) Data Modelling
3 9 (22.50%) DevOps
4 8 (20.00%) Containerisation
4 8 (20.00%) Problem-Solving
5 7 (17.50%) Cybersecurity
5 7 (17.50%) Machine Learning
6 6 (15.00%) Data Architecture
6 6 (15.00%) Data Governance
6 6 (15.00%) Data Visualisation
6 6 (15.00%) Roadmaps
6 6 (15.00%) Visualisation
7 5 (12.50%) AI
7 5 (12.50%) Infrastructure as Code
8 4 (10.00%) Continuous Improvement
8 4 (10.00%) Disaster Recovery
8 4 (10.00%) TOGAF
Programming Languages
1 18 (45.00%) SQL
2 7 (17.50%) Python
3 4 (10.00%) PowerShell
4 1 (2.50%) Bash
4 1 (2.50%) Bicep
4 1 (2.50%) C#
Qualifications
1 9 (22.50%) Azure Certification
2 8 (20.00%) BPSS Clearance
2 8 (20.00%) DV Cleared
2 8 (20.00%) Network+ Certification
2 8 (20.00%) SC Cleared
2 8 (20.00%) Security Cleared
3 4 (10.00%) TOGAF Certification
4 3 (7.50%) DBS Check
4 3 (7.50%) Degree
5 2 (5.00%) Computer Science Degree
6 1 (2.50%) ITIL Foundation Certificate
6 1 (2.50%) Master's Degree
6 1 (2.50%) Microsoft Certification
Quality Assurance & Compliance
1 5 (12.50%) Data Quality
2 3 (7.50%) GDPR
3 2 (5.00%) Accessibility
3 2 (5.00%) ISO/IEC 27001
3 2 (5.00%) NIST
System Software
1 11 (27.50%) Active Directory
2 8 (20.00%) Hyper-V
3 2 (5.00%) Docker
Systems Management
1 10 (25.00%) Kubernetes
2 3 (7.50%) Terraform
Vendors
1 22 (55.00%) Microsoft
2 8 (20.00%) Dell
3 7 (17.50%) Databricks
4 4 (10.00%) Extreme Networks
4 4 (10.00%) Juniper