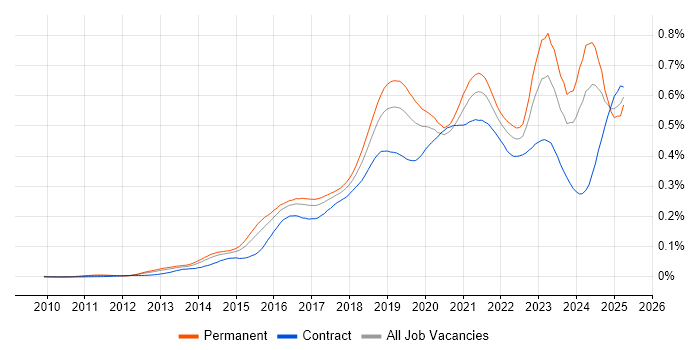
Hybrid Cloud
UK

The table below looks at the prevalence of the term Hybrid Cloud in permanent job vacancies. Included is a benchmarking guide to the salaries offered in vacancies that have cited Hybrid Cloud over the 6 months to 29 November 2023 with a comparison to the same period over the previous 2 years.

6 months to
29 Nov 2023
Same period 2022 Same period 2021
Rank 450 599 497
Rank change year-on-year +149 -102 +25
Permanent jobs citing Hybrid Cloud 296 577 805
As % of all permanent jobs advertised in the UK 0.55% 0.46% 0.62%
As % of the Miscellaneous category 1.48% 1.05% 1.41%
Number of salaries quoted 181 444 581
10th Percentile £45,000 £45,115 £45,000
25th Percentile £52,500 £57,500 £55,000
Median annual salary (50th Percentile) £65,000 £75,000 £75,000
Median % change year-on-year -13.33% - +7.14%
75th Percentile £82,500 £97,290 £95,000
90th Percentile £97,500 £110,000 £107,500
UK excluding London median annual salary £62,500 £70,000 £60,000
% change year-on-year -10.71% +16.67% -7.69%

All Generic Skills
UK

Hybrid Cloud is in the General and Transferable Skills category. The following table is for comparison with the above and provides summary statistics for all permanent job vacancies with a requirement for generic IT skills.

Permanent vacancies with a requirement for generic IT skills 20,064 55,164 57,045
As % of all permanent jobs advertised in the UK 37.08% 43.84% 44.20%
Number of salaries quoted 14,694 30,402 33,575
10th Percentile £33,500 £34,996 £33,618
25th Percentile £45,000 £46,250 £45,000
Median annual salary (50th Percentile) £62,500 £63,500 £60,000
Median % change year-on-year -1.57% +5.83% -
75th Percentile £84,056 £85,000 £82,500
90th Percentile £107,500 £105,000 £100,000
UK excluding London median annual salary £55,000 £55,000 £50,000
% change year-on-year - +10.00% -

Hybrid Cloud
Job Vacancy Trend

Job postings citing Hybrid Cloud as a proportion of all IT jobs advertised.

Job vacancy trend for Hybrid Cloud in the UK

Hybrid Cloud
Salary Trend

3-month moving average salary quoted in jobs citing Hybrid Cloud.

Salary trend for Hybrid Cloud in the UK

Hybrid Cloud
Salary Histogram

Salary distribution for jobs citing Hybrid Cloud over the 6 months to 29 November 2023.

Salary histogram for Hybrid Cloud in the UK

Hybrid Cloud
Top 17 Job Locations

The table below looks at the demand and provides a guide to the median salaries quoted in IT jobs citing Hybrid Cloud within the UK over the 6 months to 29 November 2023. The 'Rank Change' column provides an indication of the change in demand within each location based on the same 6 month period last year.

Location Rank Change
on Same Period
Last Year
Matching
Permanent
IT Job Ads
Median Salary
Past 6 Months
Median Salary
% Change
on Same Period
Last Year
Live
Jobs
England +141 253 £70,000 -6.67% 84
Work from Home +197 159 £55,000 -26.67% 34
UK excluding London +138 157 £62,500 -10.71% 57
London +160 116 £77,500 -8.82% 27
North of England +92 46 £55,000 -24.14% 11
South West +75 40 £75,000 +3.45% 11
North West +87 31 £55,000 -26.26% 9
Midlands +119 21 £62,500 -7.41% 20
South East +129 19 £65,000 -13.33% 9
Scotland +45 17 £56,250 -19.64% 2
West Midlands +111 15 £61,500 -12.14% 18
Yorkshire +80 9 £45,000 -30.77%
Northern Ireland +35 8 £33,000 -45.00%
East Midlands +46 6 £62,500 +5.93% 2
North East +38 6 £55,000 -24.14% 3
Wales +9 4 - -
East of England +107 2 £75,000 +50.00% 4

Hybrid Cloud
Co-occurring Skills and Capabilities by Category

The follow tables expand on the table above by listing co-occurrences grouped by category. The same employment type, locality and period is covered with up to 20 co-occurrences shown in each of the following categories:

Application Platforms
1 14 (4.73%) Apache
1 14 (4.73%) Apache Spark
2 12 (4.05%) Jupyter
2 12 (4.05%) nginx
3 7 (2.36%) NServiceBus
3 7 (2.36%) SharePoint
4 6 (2.03%) MS Exchange
5 4 (1.35%) IIS
6 3 (1.01%) Confluence
7 2 (0.68%) Apache Airflow
7 2 (0.68%) OpenStack
8 1 (0.34%) CMS
8 1 (0.34%) JBoss
8 1 (0.34%) Red Hat Fuse
Applications
1 2 (0.68%) Microsoft Excel
1 2 (0.68%) Microsoft Office
1 2 (0.68%) MS Visio
Business Applications
1 16 (5.41%) SAP S/4HANA
2 3 (1.01%) SAP CO
2 3 (1.01%) SAP FI
2 3 (1.01%) SAP FI/CO
3 2 (0.68%) Dynamics CRM
3 2 (0.68%) SAP IBP
3 2 (0.68%) Sparx Enterprise Architect
Cloud Services
1 143 (48.31%) AWS
2 136 (45.95%) Azure
3 81 (27.36%) GCP
4 70 (23.65%) Serverless
5 67 (22.64%) OpenShift
6 36 (12.16%) Microsoft 365
7 22 (7.43%) Entra ID
8 19 (6.42%) SaaS
9 16 (5.41%) Azure DevOps
10 14 (4.73%) Amazon S3
11 13 (4.39%) PaaS
12 12 (4.05%) MinIO
13 11 (3.72%) IaaS
14 10 (3.38%) Azure API Management
14 10 (3.38%) Azure Service Bus
14 10 (3.38%) Cloud Computing
15 9 (3.04%) Power Platform
16 7 (2.36%) Azure Data Factory
17 6 (2.03%) Azure Cosmos DB
17 6 (2.03%) Azure Functions
Communications & Networking
1 21 (7.09%) Firewall
1 21 (7.09%) VPN
2 19 (6.42%) VLAN
3 17 (5.74%) LAN
4 14 (4.73%) WAN
5 13 (4.39%) IPv4
6 11 (3.72%) DNS
7 10 (3.38%) OSPF
8 9 (3.04%) DHCP
9 8 (2.70%) SAN
10 7 (2.36%) SD-WAN
11 6 (2.03%) Cisco ISE
11 6 (2.03%) NGFW
11 6 (2.03%) Wi-Fi
12 5 (1.69%) Cisco Firepower
12 5 (1.69%) VoIP
12 5 (1.69%) Wireless
13 4 (1.35%) Software-Defined Networking
14 3 (1.01%) Cisco ASA
14 3 (1.01%) NAS
Database & Business Intelligence
1 46 (15.54%) Big Data
2 24 (8.11%) SQL Server
3 19 (6.42%) PostgreSQL
4 17 (5.74%) MySQL
5 16 (5.41%) RDBMS
5 16 (5.41%) Relational Database
6 14 (4.73%) Data Lake
7 12 (4.05%) Hadoop
7 12 (4.05%) Presto
8 7 (2.36%) Azure SQL Database
9 6 (2.03%) Amazon RDS
10 3 (1.01%) Data Warehouse
10 3 (1.01%) InterSystems Cache
10 3 (1.01%) NoSQL
10 3 (1.01%) OLTP
11 2 (0.68%) BigQuery
11 2 (0.68%) Looker
11 2 (0.68%) MongoDB
11 2 (0.68%) Power BI
12 1 (0.34%) Amazon Redshift
Development Applications
1 24 (8.11%) Git
2 21 (7.09%) Jenkins
3 12 (4.05%) Atlassian Bamboo
4 3 (1.01%) JIRA
5 1 (0.34%) GitLab
5 1 (0.34%) Subversion
5 1 (0.34%) TeamCity
General
1 68 (22.97%) Social Skills
2 59 (19.93%) Finance
3 26 (8.78%) Inclusion and Diversity
4 24 (8.11%) Retail
5 20 (6.76%) Analytical Skills
5 20 (6.76%) Law
6 12 (4.05%) Banking
7 11 (3.72%) Back Office
8 10 (3.38%) Legal
9 8 (2.70%) Influencing Skills
10 5 (1.69%) Billing
11 4 (1.35%) Aerospace
11 4 (1.35%) Aviation
11 4 (1.35%) Organisational Skills
11 4 (1.35%) Pharmaceutical
12 3 (1.01%) Financial Institution
12 3 (1.01%) Public Sector
12 3 (1.01%) Publishing
12 3 (1.01%) Telecoms
13 2 (0.68%) Investment Banking
Job Titles
1 90 (30.41%) Architect
2 57 (19.26%) Senior
3 55 (18.58%) Solutions Architect
4 36 (12.16%) Azure Engineer
5 32 (10.81%) Cloud Engineer
6 27 (9.12%) Infrastructure Engineer
7 26 (8.78%) Software Engineer
8 25 (8.45%) DV Cleared Software Engineer
8 25 (8.45%) Senior Software Engineer
9 24 (8.11%) Cloud Architect
10 21 (7.09%) Consultant
11 18 (6.08%) AWS Engineer
12 17 (5.74%) Lead
13 15 (5.07%) Azure Infrastructure Engineer
13 15 (5.07%) DevOps Engineer
14 14 (4.73%) Data Engineer
14 14 (4.73%) Developer
15 13 (4.39%) Software Developer
16 12 (4.05%) Big Data Engineer
17 11 (3.72%) AWS Infrastructure Engineer
Libraries, Frameworks & Software Standards
1 23 (7.77%) Node.js
2 22 (7.43%) Web Services
3 19 (6.42%) RabbitMQ
4 16 (5.41%) RESTful
5 13 (4.39%) hapi
5 13 (4.39%) YAML
6 12 (4.05%) ActiveMQ
6 12 (4.05%) Apache NiFi
6 12 (4.05%) Elastic Stack
7 10 (3.38%) Express.js
7 10 (3.38%) Spring
8 8 (2.70%) JSON
9 7 (2.36%) XML
10 4 (1.35%) 802.1X
10 4 (1.35%) EDI
10 4 (1.35%) SAP Fiori
11 3 (1.01%) .NET
11 3 (1.01%) Kafka
11 3 (1.01%) MACH
12 2 (0.68%) OpenAPI
Miscellaneous
1 47 (15.88%) Public Cloud
2 37 (12.50%) Data Centre
3 15 (5.07%) Cloud Native
4 12 (4.05%) Low-Code
5 11 (3.72%) Culture of Ownership
6 10 (3.38%) Blockchain
6 10 (3.38%) Life Science
7 8 (2.70%) Private Cloud
8 6 (2.03%) Cyberattack
8 6 (2.03%) IoT
8 6 (2.03%) Linux Command Line
8 6 (2.03%) Management Information System
8 6 (2.03%) Team-Oriented Environment
9 5 (1.69%) Self-Motivation
10 4 (1.35%) CMDB
10 4 (1.35%) Distributed Architecture
10 4 (1.35%) Greenfield Project
10 4 (1.35%) Operational Technology
10 4 (1.35%) Security Posture
11 3 (1.01%) Enterprise Storage
Operating Systems
1 101 (34.12%) Linux
2 49 (16.55%) Windows
3 19 (6.42%) Windows Server
4 7 (2.36%) Windows Server 2012
4 7 (2.36%) Windows Server 2016
5 6 (2.03%) Mac OS
6 5 (1.69%) Red Hat Enterprise Linux
7 3 (1.01%) Mac OS X
7 3 (1.01%) Windows Server 2019
8 2 (0.68%) VMS
9 1 (0.34%) Android
9 1 (0.34%) Unix
9 1 (0.34%) Windows Server 2008
Processes & Methodologies
1 105 (35.47%) CI/CD
2 102 (34.46%) DevOps
3 86 (29.05%) Containerisation
4 81 (27.36%) Configuration Management
5 75 (25.34%) Design Patterns
6 73 (24.66%) Microservices
7 64 (21.62%) Agile
8 61 (20.61%) Infrastructure as Code
9 60 (20.27%) Actionable Insight
10 56 (18.92%) Security Architecture
11 54 (18.24%) Loose Coupling
12 51 (17.23%) Migration
13 36 (12.16%) Software Engineering
14 35 (11.82%) Roadmaps
15 33 (11.15%) Analytics
15 33 (11.15%) Infrastructure Engineering
16 32 (10.81%) Mentoring
17 30 (10.14%) Cybersecurity
18 29 (9.80%) Cloud Security
18 29 (9.80%) IT Strategy
Programming Languages
1 89 (30.07%) Java
2 78 (26.35%) Python
3 47 (15.88%) PowerShell
4 26 (8.78%) Bash
5 14 (4.73%) Bicep
5 14 (4.73%) Shell Script
6 11 (3.72%) SQL
7 6 (2.03%) Kusto Query Language
8 5 (1.69%) Perl
9 4 (1.35%) C#
10 2 (0.68%) JavaScript
11 1 (0.34%) Go
11 1 (0.34%) Rust
11 1 (0.34%) TypeScript
11 1 (0.34%) VB
Qualifications
1 81 (27.36%) Security Cleared
2 41 (13.85%) DV Cleared
3 31 (10.47%) SC Cleared
4 21 (7.09%) Degree
5 11 (3.72%) AWS Certification
6 9 (3.04%) Azure Certification
6 9 (3.04%) Cisco Certification
7 8 (2.70%) CCNP
8 6 (2.03%) Microsoft Certification
9 4 (1.35%) Computer Science Degree
10 3 (1.01%) CCDP
10 3 (1.01%) CCIE
10 3 (1.01%) CCIE Routing and Switching
10 3 (1.01%) MCSE
11 2 (0.68%) CISM
11 2 (0.68%) CISSP
12 1 (0.34%) CCNA
12 1 (0.34%) CEH
12 1 (0.34%) ITIL Certification
12 1 (0.34%) RHCE
Quality Assurance & Compliance
1 15 (5.07%) QA
2 5 (1.69%) ISO/IEC 27001
3 4 (1.35%) Sarbanes-Oxley
4 2 (0.68%) Cyber Essentials
4 2 (0.68%) Cyber Essentials PLUS
5 1 (0.34%) NIST
5 1 (0.34%) SLA
System Software
1 84 (28.38%) Docker
2 35 (11.82%) Active Directory
3 14 (4.73%) VMware Infrastructure
4 12 (4.05%) Hyper-V
5 6 (2.03%) BitLocker
6 5 (1.69%) Virtual Machines
6 5 (1.69%) VMware ESXi
7 3 (1.01%) IAG
7 3 (1.01%) NFS
8 2 (0.68%) Firmware
8 2 (0.68%) Virtual Servers
8 2 (0.68%) vSphere
9 1 (0.34%) Ceph
9 1 (0.34%) Gluster
Systems Management
1 55 (18.58%) Terraform
2 51 (17.23%) Ansible
3 36 (12.16%) Kubernetes
4 30 (10.14%) Puppet
5 14 (4.73%) Grafana
6 13 (4.39%) Prometheus
7 12 (4.05%) HAProxy
8 9 (3.04%) Progress Chef
9 8 (2.70%) Active Directory Federation Services
10 7 (2.36%) Microsoft Intune
10 7 (2.36%) vCenter Server
11 6 (2.03%) CSIRT
12 5 (1.69%) Salt
12 5 (1.69%) SCOM
13 4 (1.35%) SCCM
14 3 (1.01%) Nagios
14 3 (1.01%) vRealize
15 2 (0.68%) Opsview
15 2 (0.68%) Oracle Identity Management
15 2 (0.68%) PowerCLI
Vendors
1 60 (20.27%) Microsoft
2 28 (9.46%) VMware
3 19 (6.42%) Oracle
4 18 (6.08%) Cisco
5 16 (5.41%) SAP
6 12 (4.05%) SolarWinds
7 6 (2.03%) Databricks
7 6 (2.03%) Intel
7 6 (2.03%) Meraki
7 6 (2.03%) ServiceNow
8 5 (1.69%) Google
8 5 (1.69%) Splunk
9 4 (1.35%) Palo Alto
9 4 (1.35%) Veeam
10 3 (1.01%) Citrix
10 3 (1.01%) HP
10 3 (1.01%) Sitecore
10 3 (1.01%) Synology
10 3 (1.01%) Workday
11 2 (0.68%) Dell