Security Engineer Jobs

Security Engineer
UK

The median Security Engineer salary in the UK is £55,000 per year, according to job vacancies posted during the 6 months leading to 30 April 2025.

The table below provides salary benchmarking and summary statistics, comparing them to the same period in the previous two years.

6 months to
30 Apr 2025
Same period 2024 Same period 2023
Rank 244 383 397
Rank change year-on-year +139 +14 +13
Permanent jobs requiring a Security Engineer 634 670 860
As % of all permanent jobs advertised in the UK 1.22% 0.68% 0.83%
As % of the Job Titles category 1.35% 0.72% 0.90%
Number of salaries quoted 366 548 624
10th Percentile £38,358 £35,000 £41,538
25th Percentile £47,231 £42,500 £51,750
Median annual salary (50th Percentile) £55,000 £59,526 £67,000
Median % change year-on-year -7.60% -11.16% +3.08%
75th Percentile £77,500 £80,000 £85,000
90th Percentile £92,500 £91,075 £100,000
UK excluding London median annual salary £53,000 £50,000 £59,526
% change year-on-year +6.00% -16.00% +13.38%

All Permanent IT Job Vacancies
UK

For comparison with the information above, the following table provides summary statistics for all permanent IT job vacancies. Most job vacancies include a discernible job title that can be normalized. As such, the figures in the second row provide an indication of the number of permanent jobs in our overall sample.

Permanent vacancies in the UK with a recognized job title 46,971 93,051 95,196
% of permanent jobs with a recognized job title 90.06% 94.62% 91.53%
Number of salaries quoted 27,308 66,827 59,871
10th Percentile £30,000 £28,500 £32,500
25th Percentile £42,500 £38,500 £45,000
Median annual salary (50th Percentile) £57,500 £52,750 £60,000
Median % change year-on-year +9.00% -12.08% -
75th Percentile £75,000 £71,250 £81,250
90th Percentile £97,500 £90,000 £100,000
UK excluding London median annual salary £52,344 £50,000 £52,500
% change year-on-year +4.69% -4.76% +5.00%

Security Engineer
Job Vacancy Trend

Job postings that featured Security Engineer in the job title as a proportion of all IT jobs advertised.
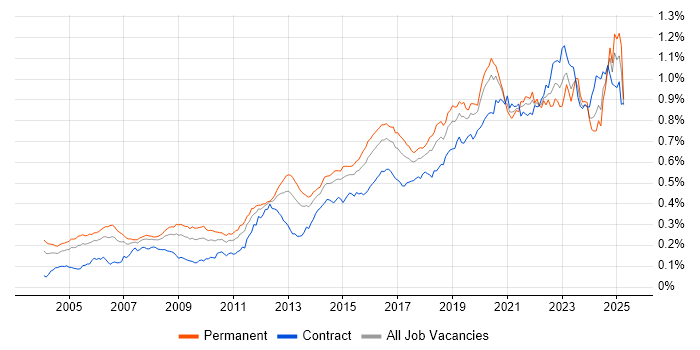
Job vacancy trend for Security Engineer in the UK

Security Engineer
Salary Trend

3-month moving average salary quoted in jobs citing Security Engineer.

Salary trend for Security Engineer in the UK

Security Engineer
Salary Histogram

Salary distribution for jobs citing Security Engineer over the 6 months to 30 April 2025.

Salary histogram for Security Engineer in the UK

Security Engineer
Top 17 Job Locations

The table below looks at the demand and provides a guide to the median salaries quoted in IT jobs citing Security Engineer within the UK over the 6 months to 30 April 2025. The 'Rank Change' column provides an indication of the change in demand within each location based on the same 6 month period last year.

Location Rank Change
on Same Period
Last Year
Matching
Permanent
IT Job Ads
Median Salary
Past 6 Months
Median Salary
% Change
on Same Period
Last Year
Live
Jobs
England +148 603 £55,000 -8.22% 482
UK excluding London +208 489 £53,000 +6.00% 336
Midlands +179 222 £49,000 -10.91% 62
West Midlands +144 153 £50,000 -9.50% 43
Work from Home +73 135 £60,000 +0.80% 221
London -6 130 £80,000 - 183
North of England +84 98 £51,237 -2.41% 75
South East +88 96 £55,000 +22.22% 82
North West +52 71 £53,250 -3.18% 51
East Midlands +96 69 £37,500 -31.82% 18
South West +130 37 £51,058 +23.91% 53
Yorkshire +51 17 £50,000 +19.76% 17
East of England +47 15 £45,000 -21.74% 27
Scotland +113 13 £90,000 +63.64% 29
North East +53 10 £45,000 -28.32% 7
Wales +31 7 £54,500 +34.57% 7
Northern Ireland +33 1 - - 7

Security Engineer Skill Set
Top 30 Co-occurring Skills and Capabilities

For the 6 months to 30 April 2025, Security Engineer job roles required the following skills and capabilities in order of popularity. The figures indicate the absolute number co-occurrences and as a proportion of all permanent job ads featuring Security Engineer in the job title.

1 363 (57.26%) Cybersecurity
2 303 (47.79%) Degree
3 236 (37.22%) NIST
4 231 (36.44%) BPSS Clearance
5 224 (35.33%) Information Security
6 221 (34.86%) ISO/IEC 27001
7 220 (34.70%) CISSP
8 219 (34.54%) Risk Management
9 182 (28.71%) CISM
10 166 (26.18%) Security Testing
11 156 (24.61%) JSP 440
12 150 (23.66%) Cyber Resilience
13 149 (23.50%) Project Management
14 147 (23.19%) RMADS
14 147 (23.19%) CESG Certified Professional
15 137 (21.61%) Firewall
16 128 (20.19%) Azure
17 123 (19.40%) Cloud Security
18 109 (17.19%) AWS
19 100 (15.77%) Security Posture
20 96 (15.14%) Finance
21 94 (14.83%) Microsoft
21 94 (14.83%) Vulnerability Management
22 91 (14.35%) Social Skills
23 85 (13.41%) Network Security
24 77 (12.15%) Computer Science
25 74 (11.67%) DevOps
26 72 (11.36%) Problem-Solving
27 70 (11.04%) Security Operations
28 67 (10.57%) Python

Security Engineer Skill Set
Co-occurring Skills and Capabilities by Category

The follow tables expand on the table above by listing co-occurrences grouped by category. The same employment type, locality and period is covered with up to 20 co-occurrences shown in each of the following categories:

Application Platforms
1 6 (0.95%) SharePoint
2 5 (0.79%) Microsoft Exchange
3 3 (0.47%) Confluence
4 1 (0.16%) IIS
Applications
1 1 (0.16%) Microsoft Office
1 1 (0.16%) MS Visio
Cloud Services
1 128 (20.19%) Azure
2 109 (17.19%) AWS
3 35 (5.52%) Microsoft 365
4 24 (3.79%) Azure Sentinel
4 24 (3.79%) PaaS
5 21 (3.31%) Entra ID
6 20 (3.15%) GCP
7 18 (2.84%) Azure DevOps
8 15 (2.37%) SaaS
9 14 (2.21%) Microsoft Purview
10 11 (1.74%) IaaS
11 10 (1.58%) Cloud Computing
11 10 (1.58%) GitHub
12 7 (1.10%) Azure AKS
13 4 (0.63%) OneDrive
13 4 (0.63%) Serverless
14 3 (0.47%) Amazon GuardDuty
14 3 (0.47%) Amazon S3
14 3 (0.47%) AWS Lambda
14 3 (0.47%) Azure Key Vault
Communications & Networking
1 137 (21.61%) Firewall
2 85 (13.41%) Network Security
3 37 (5.84%) VPN
4 30 (4.73%) BGP
5 27 (4.26%) OSPF
6 26 (4.10%) EIGRP
7 25 (3.94%) DNS
8 24 (3.79%) TCP/IP
9 15 (2.37%) DHCP
10 13 (2.05%) HTTP
10 13 (2.05%) WAN
10 13 (2.05%) Wireless
11 10 (1.58%) Cisco ASA
11 10 (1.58%) Intrusion Detection
12 9 (1.42%) SMTP
13 8 (1.26%) Cisco Firepower
14 6 (0.95%) LAN
14 6 (0.95%) SD-WAN
14 6 (0.95%) VLAN
15 4 (0.63%) Internet
Database & Business Intelligence
1 12 (1.89%) PostgreSQL
2 3 (0.47%) GIS
2 3 (0.47%) SQL Server
3 2 (0.32%) Big Data
4 1 (0.16%) DB2
4 1 (0.16%) Hadoop
4 1 (0.16%) MongoDB
Development Applications
1 11 (1.74%) Jenkins
2 9 (1.42%) Git
3 8 (1.26%) GitLab
3 8 (1.26%) Robot Framework
4 3 (0.47%) Bitbucket
4 3 (0.47%) JIRA
5 1 (0.16%) Burp Suite
General
1 96 (15.14%) Finance
2 91 (14.35%) Social Skills
3 44 (6.94%) Law
4 28 (4.42%) Analytical Skills
5 24 (3.79%) Inclusion and Diversity
6 19 (3.00%) Banking
6 19 (3.00%) Telecoms
7 17 (2.68%) Pharmaceutical
8 16 (2.52%) Legal
9 14 (2.21%) Retail
10 12 (1.89%) Manufacturing
11 6 (0.95%) Influencing Skills
11 6 (0.95%) Organisational Skills
12 4 (0.63%) Local Government
12 4 (0.63%) Police
13 3 (0.47%) Marketing
14 2 (0.32%) Automotive
14 2 (0.32%) Public Sector
15 1 (0.16%) Advertising
15 1 (0.16%) Investment Banking
Libraries, Frameworks & Software Standards
1 14 (2.21%) React
1 14 (2.21%) YAML
2 11 (1.74%) REST
3 8 (1.26%) Django
3 8 (1.26%) GraphQL
4 7 (1.10%) Azure Blueprints
5 6 (0.95%) AngularJS
5 6 (0.95%) Middleware
6 5 (0.79%) SailPoint
6 5 (0.79%) SLSA
7 4 (0.63%) .NET
8 3 (0.47%) Web Services
9 2 (0.32%) OAuth
9 2 (0.32%) OAuth2
10 1 (0.16%) 802.1X
10 1 (0.16%) HTML
10 1 (0.16%) JSON
10 1 (0.16%) LDAP
10 1 (0.16%) Microsoft Graph
Miscellaneous
1 100 (15.77%) Security Posture
2 39 (6.15%) Management Information System
3 27 (4.26%) Cloud Security Posture
4 24 (3.79%) CCTV
5 23 (3.63%) Cyber Threat
6 18 (2.84%) Cloud Native
7 12 (1.89%) Public Cloud
8 10 (1.58%) Product Ownership
8 10 (1.58%) Self-Motivation
9 9 (1.42%) Cyber Security Posture
9 9 (1.42%) Hybrid Cloud
9 9 (1.42%) PKI
10 8 (1.26%) Greenfield Project
10 8 (1.26%) Security Operations Centre
11 7 (1.10%) Driving Licence
12 5 (0.79%) Blog
13 4 (0.63%) Cyberattack
13 4 (0.63%) Distributed Denial-of-Service
13 4 (0.63%) Mobile App
14 3 (0.47%) Virtual Team
Operating Systems
1 37 (5.84%) Windows
2 34 (5.36%) Linux
3 18 (2.84%) Windows Server
4 15 (2.37%) Red Hat Enterprise Linux
5 8 (1.26%) Rocky
6 5 (0.79%) VMS
7 4 (0.63%) Android
7 4 (0.63%) Apple iOS
8 3 (0.47%) Windows Server 2012
8 3 (0.47%) Windows Server 2019
9 1 (0.16%) Mac OS
9 1 (0.16%) Windows 10
9 1 (0.16%) Windows Server 2016
Processes & Methodologies
1 363 (57.26%) Cybersecurity
2 224 (35.33%) Information Security
3 219 (34.54%) Risk Management
4 166 (26.18%) Security Testing
5 150 (23.66%) Cyber Resilience
6 149 (23.50%) Project Management
7 123 (19.40%) Cloud Security
8 94 (14.83%) Vulnerability Management
9 77 (12.15%) Computer Science
10 74 (11.67%) DevOps
11 72 (11.36%) Problem-Solving
12 70 (11.04%) Security Operations
13 59 (9.31%) SIEM
14 56 (8.83%) Incident Response
14 56 (8.83%) Vulnerability Remediation
15 55 (8.68%) Continuous Improvement
16 51 (8.04%) CI/CD
17 50 (7.89%) Infrastructure Engineering
17 50 (7.89%) Roadmaps
18 49 (7.73%) Mentoring
Programming Languages
1 67 (10.57%) Python
2 65 (10.25%) PowerShell
3 18 (2.84%) Bash
4 16 (2.52%) C++
5 10 (1.58%) SQL
5 10 (1.58%) TypeScript
6 9 (1.42%) Java
6 9 (1.42%) JavaScript
7 8 (1.26%) C
7 8 (1.26%) Perl
8 7 (1.10%) Kusto Query Language
9 5 (0.79%) Go
10 4 (0.63%) Kotlin
10 4 (0.63%) Objective-C
10 4 (0.63%) Rust
11 3 (0.47%) Ruby
12 2 (0.32%) Apex Code
12 2 (0.32%) Solidity
13 1 (0.16%) Bicep
Qualifications
1 303 (47.79%) Degree
2 231 (36.44%) BPSS Clearance
3 220 (34.70%) CISSP
4 182 (28.71%) CISM
5 147 (23.19%) CESG Certified Professional
6 56 (8.83%) Security Cleared
7 43 (6.78%) SC Cleared
8 36 (5.68%) DV Cleared
9 33 (5.21%) AWS Certification
10 32 (5.05%) Cisco Certification
11 28 (4.42%) Computer Science Degree
12 21 (3.31%) SANS
13 20 (3.15%) AWS Certified Cloud Practitioner
13 20 (3.15%) HNC
13 20 (3.15%) HND
14 18 (2.84%) CEH
15 17 (2.68%) GIAC
15 17 (2.68%) Master's Degree
16 15 (2.37%) CCNP
17 14 (2.21%) (ISC)2 CCSP
Quality Assurance & Compliance
1 236 (37.22%) NIST
2 221 (34.86%) ISO/IEC 27001
3 156 (24.61%) JSP 440
4 147 (23.19%) RMADS
5 52 (8.20%) GDPR
6 42 (6.62%) NCSC
7 26 (4.10%) Cyber Essentials
8 24 (3.79%) Accessibility
9 19 (3.00%) PCI DSS
10 13 (2.05%) Cyber Essentials PLUS
11 10 (1.58%) GRC
11 10 (1.58%) Sarbanes-Oxley
12 8 (1.26%) HIPAA
13 7 (1.10%) SOC 2
14 4 (0.63%) California Consumer Privacy Act
15 3 (0.47%) ISO/IEC 27002 (supersedes ISO/IEC 17799)
16 1 (0.16%) ISO/IEC 27005
16 1 (0.16%) SLA
System Software
1 21 (3.31%) Virtual Machines
2 20 (3.15%) Active Directory
3 15 (2.37%) VMware Infrastructure
4 13 (2.05%) VMware ESXi
5 6 (0.95%) Docker
5 6 (0.95%) Hyper-V
6 4 (0.63%) vSphere
7 3 (0.47%) Firmware
8 1 (0.16%) BitLocker
Systems Management
1 29 (4.57%) Terraform
2 19 (3.00%) FortiGate
3 16 (2.52%) Microsoft Intune
4 15 (2.37%) Kubernetes
5 14 (2.21%) Nessus
6 12 (1.89%) Ansible
7 10 (1.58%) CASB
8 7 (1.10%) SCCM
9 6 (0.95%) Single Sign-On
10 5 (0.79%) Istio
10 5 (0.79%) linkerd
10 5 (0.79%) vCenter Server
10 5 (0.79%) WSUS
11 3 (0.47%) Computer Incident Response Team
11 3 (0.47%) Host Intrusion Detection System
11 3 (0.47%) QRadar
12 2 (0.32%) EnCase
12 2 (0.32%) FTK
12 2 (0.32%) RSA Security Analytics
13 1 (0.16%) Prometheus
Vendors
1 94 (14.83%) Microsoft
2 59 (9.31%) Cisco
3 43 (6.78%) Fortinet
4 27 (4.26%) VMware
5 18 (2.84%) Google
5 18 (2.84%) Palo Alto
6 16 (2.52%) Juniper
7 15 (2.37%) Splunk
8 14 (2.21%) Tenable
9 9 (1.42%) CrowdStrike
10 8 (1.26%) Red Hat
11 7 (1.10%) CyberArk
11 7 (1.10%) Okta
11 7 (1.10%) Qualys
12 6 (0.95%) CheckPoint
12 6 (0.95%) ServiceNow
13 5 (0.79%) Ping Identity
14 4 (0.63%) Extreme Networks
14 4 (0.63%) Rapid7
14 4 (0.63%) Zscaler