Technical Architect
UK

The median Technical Architect salary in the UK is £82,500 per year according to job vacancies posted during the 6 months to 5 December 2023.

The first table below provides salary benchmarking and summary statistics including a comparison to same period in the previous 2 years.

6 months to
5 Dec 2023
Same period 2022 Same period 2021
Rank 389 515 517
Rank change year-on-year +126 +2 -39
Permanent jobs requiring a Technical Architect 389 726 760
As % of all permanent jobs advertised in the UK 0.73% 0.58% 0.60%
As % of the Job Titles category 0.76% 0.61% 0.63%
Number of salaries quoted 247 451 554
10th Percentile £56,658 £57,674 £52,500
25th Percentile £68,109 £71,000 £65,000
Median annual salary (50th Percentile) £82,500 £85,000 £75,000
Median % change year-on-year -2.94% +13.33% +3.45%
75th Percentile £90,000 £95,000 £92,500
90th Percentile £103,950 £110,000 £100,000
UK excluding London median annual salary £75,000 £80,000 £70,000
% change year-on-year -6.25% +14.29% +7.69%

All Permanent IT Job Vacancies
UK

The following table is for comparison with the above and includes summary statistics for all permanent IT job vacancies. Most job vacancies include a discernible job title that can be normalized. As such, the figures in the second row provide an indication of the number of permanent jobs in our overall sample.

Permanent vacancies in the UK with a recognized job title 50,985 118,425 121,174
% of permanent jobs with a recognized job title 95.43% 95.37% 95.14%
Number of salaries quoted 37,346 74,222 83,417
10th Percentile £31,250 £32,750 £32,000
25th Percentile £42,500 £45,000 £42,500
Median annual salary (50th Percentile) £60,000 £60,000 £57,500
Median % change year-on-year - +4.35% +4.55%
75th Percentile £80,000 £81,250 £77,500
90th Percentile £97,500 £98,750 £95,000
UK excluding London median annual salary £52,500 £52,500 £50,000
% change year-on-year - +5.00% +5.26%

Technical Architect
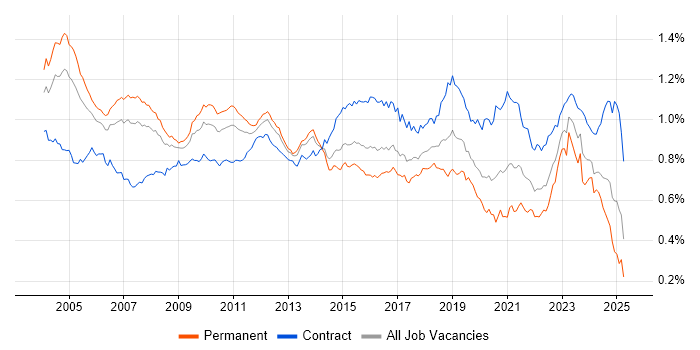
Job Vacancy Trend

Job postings that featured Technical Architect in the job title as a proportion of all IT jobs advertised.

Job vacancy trend for Technical Architect in the UK

Technical Architect
Salary Trend

3-month moving average salary quoted in jobs citing Technical Architect.

Salary trend for Technical Architect in the UK

Technical Architect
Salary Histogram

Salary distribution for jobs citing Technical Architect over the 6 months to 5 December 2023.

Salary histogram for Technical Architect in the UK

Technical Architect
Top 16 Job Locations

The table below looks at the demand and provides a guide to the median salaries quoted in IT jobs citing Technical Architect within the UK over the 6 months to 5 December 2023. The 'Rank Change' column provides an indication of the change in demand within each location based on the same 6 month period last year.

Location Rank Change
on Same Period
Last Year
Matching
Permanent
IT Job Ads
Median Salary
Past 6 Months
Median Salary
% Change
on Same Period
Last Year
Live
Jobs
England +99 287 £85,000 - 121
UK excluding London +120 187 £75,000 -6.25% 77
London +113 144 £85,000 -5.56% 48
Work from Home +144 139 £75,000 -6.25% 79
South West +70 44 £79,000 -1.25% 20
North of England +97 39 £82,500 +10.00% 21
South East +106 31 £66,250 -22.06% 21
Scotland +78 27 £70,576 -5.90% 3
Yorkshire +79 22 £87,500 +16.67% 6
North West +103 17 £82,500 -2.94% 14
Midlands +102 13 £88,500 +15.31% 5
Wales +26 13 £62,989 -25.90% 3
East of England +99 11 £85,000 +9.68% 9
Northern Ireland +45 9 £65,000 -13.33% 2
East Midlands +43 8 £80,000 +8.47% 3
West Midlands +97 5 £88,500 +15.31% 2

Technical Architect Skill Set
Top 30 Co-occurring Skills and Capabilities

For the 6 months to 5 December 2023, Technical Architect job roles required the following skills and capabilities in order of popularity. The figures indicate the absolute number co-occurrences and as a proportion of all permanent job ads featuring Technical Architect in the job title.

1 145 (37.28%) Azure
2 139 (35.73%) Security Cleared
3 136 (34.96%) Social Skills
4 134 (34.45%) Agile
5 130 (33.42%) AWS
6 121 (31.11%) SC Cleared
7 96 (24.68%) Problem-Solving
8 83 (21.34%) Roadmaps
8 83 (21.34%) DevOps
8 83 (21.34%) Java
9 75 (19.28%) C#
10 74 (19.02%) Python
10 74 (19.02%) Technical Architecture
11 72 (18.51%) TOGAF
11 72 (18.51%) Microservices
11 72 (18.51%) Actionable Insight
12 69 (17.74%) Microsoft
13 58 (14.91%) JavaScript
14 57 (14.65%) Kubernetes
15 56 (14.40%) Finance
16 54 (13.88%) Technical Leadership
17 53 (13.62%) Architectural Patterns
18 49 (12.60%) Degree
19 47 (12.08%) Migration
19 47 (12.08%) Oracle
19 47 (12.08%) Mentoring
20 45 (11.57%) Enterprise Architecture
21 42 (10.80%) Project Delivery
22 41 (10.54%) Design Patterns
22 41 (10.54%) Management Information System

Technical Architect Skill Set
Co-occurring Skills and Capabilities by Category

The follow tables expand on the table above by listing co-occurrences grouped by category. The same employment type, locality and period is covered with up to 20 co-occurrences shown in each of the following categories:

Application Platforms
1 19 (4.88%) CMS
2 9 (2.31%) Confluence
3 6 (1.54%) Oracle SOA Suite
3 6 (1.54%) SharePoint
4 5 (1.29%) Adobe Experience Manager
5 2 (0.51%) Appian
5 2 (0.51%) IIS
5 2 (0.51%) Kentico
5 2 (0.51%) Oracle Workflow
5 2 (0.51%) Red Hat Fuse
6 1 (0.26%) Apache Spark
6 1 (0.26%) Cloud Foundry
6 1 (0.26%) Headless CMS
6 1 (0.26%) NetWeaver
Applications
1 1 (0.26%) MS Visio
Business Applications
1 18 (4.63%) Elite 3E
1 18 (4.63%) Remedy ITSM
2 11 (2.83%) Oracle EBS
3 4 (1.03%) Magento
3 4 (1.03%) Salesforce CRM
3 4 (1.03%) SAP S/4HANA
4 3 (0.77%) Dynamics CRM
4 3 (0.77%) SAP Hybris
5 2 (0.51%) SAP ERP
5 2 (0.51%) SAP FI
6 1 (0.26%) Adobe Campaign
6 1 (0.26%) SAP CO
6 1 (0.26%) SAP FI/CO
6 1 (0.26%) SAP SD
Cloud Services
1 145 (37.28%) Azure
2 130 (33.42%) AWS
3 38 (9.77%) Serverless
4 37 (9.51%) SaaS
5 33 (8.48%) PaaS
6 25 (6.43%) IaaS
7 20 (5.14%) Microsoft 365
8 17 (4.37%) Cloud Computing
9 16 (4.11%) Entra ID
10 11 (2.83%) AWS CodePipeline
10 11 (2.83%) Azure Cosmos DB
10 11 (2.83%) GCP
10 11 (2.83%) Sentry
11 10 (2.57%) Azure Sentinel
12 8 (2.06%) Azure API Management
13 7 (1.80%) Amazon CloudWatch
13 7 (1.80%) Azure Functions
13 7 (1.80%) Figma
13 7 (1.80%) OpenShift
14 6 (1.54%) Azure DevOps
Communications & Networking
1 22 (5.66%) LAN
2 13 (3.34%) Firewall
3 7 (1.80%) SAN
4 5 (1.29%) SD-WAN
5 4 (1.03%) VPN
6 3 (0.77%) WAN
7 2 (0.51%) DNS
7 2 (0.51%) FTP
7 2 (0.51%) HTTP
7 2 (0.51%) ICMP
7 2 (0.51%) Internet
7 2 (0.51%) MPLS
7 2 (0.51%) SMTP
7 2 (0.51%) TCP/IP
7 2 (0.51%) TETRA
7 2 (0.51%) VLAN
7 2 (0.51%) VoIP
7 2 (0.51%) Wi-Fi
7 2 (0.51%) Wireless
7 2 (0.51%) WLAN
Database & Business Intelligence
1 33 (8.48%) SQL Server
2 23 (5.91%) Relational Database
3 18 (4.63%) MySQL
4 10 (2.57%) Big Data
5 8 (2.06%) MongoDB
6 6 (1.54%) Redis
7 5 (1.29%) Azure SQL Database
8 4 (1.03%) Data Lake
8 4 (1.03%) Elasticsearch
8 4 (1.03%) NoSQL
9 3 (0.77%) Amazon RDS
10 2 (0.51%) Data Warehouse
10 2 (0.51%) GIS
11 1 (0.26%) Apache Cassandra
11 1 (0.26%) DynamoDB
11 1 (0.26%) Oracle Database
11 1 (0.26%) PostgreSQL
11 1 (0.26%) Power BI
11 1 (0.26%) RDBMS
11 1 (0.26%) SQL Server Integration Services
Development Applications
1 33 (8.48%) JIRA
2 23 (5.91%) Jenkins
3 13 (3.34%) GitLab
4 11 (2.83%) CircleCI
5 4 (1.03%) Cucumber
5 4 (1.03%) Git
6 3 (0.77%) Selenium
7 2 (0.51%) Atlassian Bamboo
7 2 (0.51%) JUnit
7 2 (0.51%) Maven
8 1 (0.26%) DbUnit
8 1 (0.26%) jMock
8 1 (0.26%) Mockito
8 1 (0.26%) Postman
8 1 (0.26%) SoapUI
8 1 (0.26%) SonarQube
8 1 (0.26%) TestNG
General
1 136 (34.96%) Social Skills
2 56 (14.40%) Finance
3 34 (8.74%) Public Sector
4 29 (7.46%) Presentation Skills
5 24 (6.17%) Aerospace
5 24 (6.17%) Legal
6 19 (4.88%) Banking
7 16 (4.11%) Retail
8 14 (3.60%) Telecoms
9 12 (3.08%) Analytical Skills
9 12 (3.08%) Automotive
9 12 (3.08%) Marketing
9 12 (3.08%) Pharmaceutical
10 11 (2.83%) Inclusion and Diversity
11 10 (2.57%) Manufacturing
12 8 (2.06%) Games
13 5 (1.29%) Local Government
14 4 (1.03%) Corporate Banking
15 3 (0.77%) Billing
15 3 (0.77%) Investment Banking
Libraries, Frameworks & Software Standards
1 39 (10.03%) Node.js
2 36 (9.25%) Web Services
3 31 (7.97%) REST
4 30 (7.71%) HTML
5 29 (7.46%) React
6 27 (6.94%) .NET
7 25 (6.43%) SOAP
8 23 (5.91%) JSON
9 21 (5.40%) XML
10 17 (4.37%) RESTful
11 16 (4.11%) Kafka
12 14 (3.60%) Spring
13 10 (2.57%) Next.js
13 10 (2.57%) Spring Boot
14 9 (2.31%) Middleware
15 8 (2.06%) .NET Framework
15 8 (2.06%) Django
16 6 (1.54%) CSS
17 5 (1.29%) .NET Core
17 5 (1.29%) jQuery
Miscellaneous
1 41 (10.54%) Management Information System
2 37 (9.51%) Public Cloud
3 32 (8.23%) Data Centre
4 30 (7.71%) Legacy Systems
5 24 (6.17%) Cloud Native
6 13 (3.34%) Onboarding
6 13 (3.34%) PKI
6 13 (3.34%) Private Cloud
7 12 (3.08%) Cyberattack
8 8 (2.06%) Client/Server
8 8 (2.06%) Distributed Architecture
8 8 (2.06%) Distributed Systems
8 8 (2.06%) iPhone
9 6 (1.54%) Blockchain
9 6 (1.54%) Hybrid Cloud
10 5 (1.29%) IoT
10 5 (1.29%) Product Ownership
10 5 (1.29%) Robotics
11 4 (1.03%) Enterprise Software
12 3 (0.77%) Clustering
Operating Systems
1 28 (7.20%) Linux
2 15 (3.86%) Windows
3 8 (2.06%) Android
3 8 (2.06%) Apple iOS
4 2 (0.51%) Ubuntu
4 2 (0.51%) Windows Server
5 1 (0.26%) Red Hat Enterprise Linux
Processes & Methodologies
1 134 (34.45%) Agile
2 96 (24.68%) Problem-Solving
3 83 (21.34%) DevOps
3 83 (21.34%) Roadmaps
4 74 (19.02%) Technical Architecture
5 72 (18.51%) Actionable Insight
5 72 (18.51%) Microservices
5 72 (18.51%) TOGAF
6 54 (13.88%) Technical Leadership
7 53 (13.62%) Architectural Patterns
8 47 (12.08%) Mentoring
8 47 (12.08%) Migration
9 45 (11.57%) Enterprise Architecture
10 42 (10.80%) Project Delivery
11 41 (10.54%) Design Patterns
12 40 (10.28%) Collaborative Working
12 40 (10.28%) Stakeholder Management
13 39 (10.03%) Analytics
13 39 (10.03%) CRM
14 38 (9.77%) Continuous Integration
Programming Languages
1 83 (21.34%) Java
2 75 (19.28%) C#
3 74 (19.02%) Python
4 58 (14.91%) JavaScript
5 30 (7.71%) SQL
6 18 (4.63%) Perl
7 12 (3.08%) PL/SQL
8 11 (2.83%) PowerShell
9 10 (2.57%) TypeScript
10 9 (2.31%) Kotlin
11 8 (2.06%) BrightScript
11 8 (2.06%) Objective-C
12 6 (1.54%) Bash
12 6 (1.54%) Kusto Query Language
12 6 (1.54%) PHP
13 4 (1.03%) Bicep
13 4 (1.03%) Go
14 3 (0.77%) Apex Code
15 2 (0.51%) ABAP
15 2 (0.51%) Scala
Qualifications
1 139 (35.73%) Security Cleared
2 121 (31.11%) SC Cleared
3 49 (12.60%) Degree
4 37 (9.51%) AWS Certification
5 24 (6.17%) Azure Certification
6 19 (4.88%) CISM
6 19 (4.88%) CISSP
6 19 (4.88%) Master's Degree
7 18 (4.63%) OSCP
8 15 (3.86%) BPSS Clearance
9 13 (3.34%) Microsoft Certification
10 12 (3.08%) Computer Science Degree
11 11 (2.83%) DV Cleared
11 11 (2.83%) MBA
12 9 (2.31%) TOGAF Certification
13 7 (1.80%) MCSE
14 6 (1.54%) Cisco Certification
15 5 (1.29%) ISACA
15 5 (1.29%) ISSAP
16 4 (1.03%) (ISC)2 CCSP
Quality Assurance & Compliance
1 12 (3.08%) ISO/IEC 27001
2 9 (2.31%) QA
3 7 (1.80%) PCI DSS
4 6 (1.54%) GAAP
4 6 (1.54%) ISO 9000
5 4 (1.03%) Cyber Essentials
5 4 (1.03%) Cyber Essentials PLUS
5 4 (1.03%) IASME
6 3 (0.77%) Data Quality
7 2 (0.51%) GDPR
7 2 (0.51%) Government Security Classifications
7 2 (0.51%) NCSC
8 1 (0.26%) GAMP
8 1 (0.26%) PMO
8 1 (0.26%) SLA
System Software
1 40 (10.28%) Docker
2 24 (6.17%) Active Directory
3 16 (4.11%) VMware Infrastructure
4 5 (1.29%) Hyper-V
5 3 (0.77%) KVM
5 3 (0.77%) Virtual Machines
5 3 (0.77%) VMware ESXi
5 3 (0.77%) VMware NSX
6 2 (0.51%) Firmware
6 2 (0.51%) Virtual Servers
7 1 (0.26%) Apache ZooKeeper
7 1 (0.26%) Oracle RAC
Systems Management
1 57 (14.65%) Kubernetes
2 11 (2.83%) Ansible
2 11 (2.83%) Grafana
2 11 (2.83%) Kibana
2 11 (2.83%) Prometheus
3 9 (2.31%) Puppet
3 9 (2.31%) Terraform
4 3 (0.77%) Nagios
4 3 (0.77%) SCCM
4 3 (0.77%) vCenter Server
4 3 (0.77%) vRealize
5 2 (0.51%) Progress Chef
5 2 (0.51%) ZABBIX
6 1 (0.26%) Consul
6 1 (0.26%) Oracle RMAN
6 1 (0.26%) SCOM
Vendors
1 69 (17.74%) Microsoft
2 47 (12.08%) Oracle
3 31 (7.97%) ServiceNow
4 26 (6.68%) Salesforce
5 24 (6.17%) VMware
6 22 (5.66%) Remedy
7 21 (5.40%) Cisco
8 18 (4.63%) BMC
8 18 (4.63%) HP
9 12 (3.08%) SAP
10 11 (2.83%) Adobe
11 8 (2.06%) Google
12 7 (1.80%) Salesforce Marketing Cloud
13 5 (1.29%) Citrix
14 4 (1.03%) Databricks
14 4 (1.03%) Dell
14 4 (1.03%) MuleSoft
14 4 (1.03%) Sitecore
15 3 (0.77%) Juniper
15 3 (0.77%) Palo Alto