Disclosure and Barring Service (DBS) Checks
UK

The following table provides summary statistics for permanent job vacancies with a requirement for DBS Check qualifications. Included is a benchmarking guide to the salaries offered over the 6 months to 7 December 2023 with a comparison to the same period in the previous 2 years.

6 months to
7 Dec 2023
Same period 2022 Same period 2021
Rank 256 552 638
Rank change year-on-year +296 +86 +10
Permanent jobs citing DBS Check 704 636 491
As % of all permanent jobs advertised in the UK 1.33% 0.52% 0.38%
As % of the Qualifications category 4.08% 1.76% 1.55%
Number of salaries quoted 527 298 300
10th Percentile £23,800 £24,500 £22,000
25th Percentile £26,250 £28,125 £25,375
Median annual salary (50th Percentile) £38,000 £39,000 £36,500
Median % change year-on-year -2.56% +6.85% +9.36%
75th Percentile £39,085 £56,250 £50,000
90th Percentile £60,000 £65,089 £60,000
UK excluding London median annual salary £39,085 £42,500 £32,538
% change year-on-year -8.04% +30.61% +8.46%

All Academic and Professional Certifications
UK

DBS Check is in the Academic Qualifications and Professional Certifications category. The following table is for comparison with the above and provides summary statistics for all permanent job vacancies with a requirement for academic qualifications or professional certifications.

Permanent vacancies requiring academic qualifications or professional certifications 17,261 36,220 31,728
As % of all permanent jobs advertised in the UK 32.58% 29.49% 24.76%
Number of salaries quoted 10,821 16,971 17,946
10th Percentile £31,207 £31,250 £31,250
25th Percentile £42,000 £41,250 £41,250
Median annual salary (50th Percentile) £57,500 £57,500 £55,000
Median % change year-on-year - +4.55% -
75th Percentile £75,000 £76,250 £73,000
90th Percentile £92,500 £93,750 £90,000
UK excluding London median annual salary £52,500 £50,000 £50,000
% change year-on-year +5.00% - +2.04%

DBS Check
Job Vacancy Trend

Job postings citing DBS Check as a proportion of all IT jobs advertised.
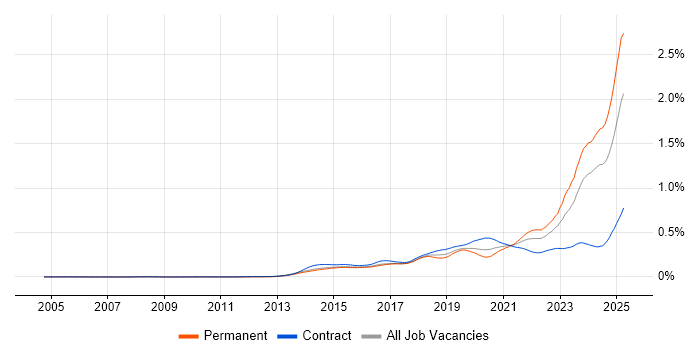
Job vacancy trend for DBS Check in the UK

DBS Check
Salary Trend

3-month moving average salary quoted in jobs citing DBS Check.

Salary trend for DBS Check in the UK

DBS Check
Salary Histogram

Salary distribution for jobs citing DBS Check over the 6 months to 7 December 2023.

Salary histogram for DBS Check in the UK

DBS Check
Top 18 Job Locations

The table below looks at the demand and provides a guide to the median salaries quoted in IT jobs citing DBS Check within the UK over the 6 months to 7 December 2023. The 'Rank Change' column provides an indication of the change in demand within each location based on the same 6 month period last year.

Location Rank Change
on Same Period
Last Year
Matching
Permanent
IT Job Ads
Median Salary
Past 6 Months
Median Salary
% Change
on Same Period
Last Year
Live
Jobs
England +281 658 £35,000 -10.26% 530
UK excluding London +179 456 £39,085 -8.04% 461
London +364 226 £36,800 -5.64% 132
South East +117 174 £39,085 +4.20% 153
Work from Home +140 105 £42,500 -9.09% 169
East of England +127 84 £39,085 -28.94% 35
South West +132 69 £30,000 +4.74% 73
Midlands +81 60 £38,000 +32.17% 83
West Midlands +91 44 £38,000 +37.19% 46
North of England +79 36 £26,000 -38.82% 88
North West +82 27 £26,000 -37.35% 51
Wales +29 20 £42,500 -5.51% 27
East Midlands +39 16 £43,750 +45.83% 37
Yorkshire +79 8 £25,000 -43.62% 25
Northern Ireland - 6 £29,993 - 4
Scotland +39 5 £45,000 - 12
Channel Islands - 2 - -
North East +39 1 - - 14

DBS Check
Co-occurring Skills and Capabilities by Category

The follow tables expand on the table above by listing co-occurrences grouped by category. The same employment type, locality and period is covered with up to 20 co-occurrences shown in each of the following categories:

Application Platforms
1 10 (1.42%) SharePoint
2 8 (1.14%) MS Exchange
3 4 (0.57%) Confluence
3 4 (0.57%) SAS
4 3 (0.43%) IIS
4 3 (0.43%) WordPress
5 2 (0.28%) Moodle
6 1 (0.14%) Apache
6 1 (0.14%) OpenStack
Applications
1 90 (12.78%) Microsoft Office
2 68 (9.66%) Spreadsheet
3 22 (3.13%) Microsoft Excel
4 7 (0.99%) AutoCAD
5 3 (0.43%) OrCAD
6 2 (0.28%) CATIA
6 2 (0.28%) Microsoft Project
7 1 (0.14%) Microsoft PowerPoint
7 1 (0.14%) SOLIDWORKS
Business Applications
1 8 (1.14%) ResourceLink
2 3 (0.43%) Academy Revenues and Benefits
3 2 (0.28%) SAP S/4HANA
3 2 (0.28%) SystmOne
4 1 (0.14%) Dynamics CRM
4 1 (0.14%) Hyperion Planning
4 1 (0.14%) iTrent
Cloud Services
1 79 (11.22%) Azure
2 71 (10.09%) Microsoft 365
3 17 (2.41%) AWS
3 17 (2.41%) Azure DevOps
4 13 (1.85%) Entra ID
5 9 (1.28%) Cloud Computing
5 9 (1.28%) GCP
5 9 (1.28%) SaaS
6 7 (0.99%) Mimecast
6 7 (0.99%) Power Platform
7 4 (0.57%) GitHub
7 4 (0.57%) Google Workspace
8 3 (0.43%) Amazon EC2
8 3 (0.43%) Amazon SQS
8 3 (0.43%) AWS Lambda
8 3 (0.43%) AWS Step Functions
8 3 (0.43%) PaaS
8 3 (0.43%) Serverless
9 2 (0.28%) Azure Logic Apps
9 2 (0.28%) Power Automate
Communications & Networking
1 30 (4.26%) Wireless
2 29 (4.12%) Firewall
3 28 (3.98%) DHCP
3 28 (3.98%) DNS
4 23 (3.27%) VLAN
5 14 (1.99%) VPN
6 13 (1.85%) Wi-Fi
7 11 (1.56%) VoIP
8 10 (1.42%) LAN
8 10 (1.42%) WAN
9 9 (1.28%) TCP/IP
10 5 (0.71%) Internet
11 4 (0.57%) F5 BIG-IP LTM
11 4 (0.57%) Network Security
12 3 (0.43%) ATM
13 1 (0.14%) HTTP
13 1 (0.14%) OSPF
13 1 (0.14%) SAN
13 1 (0.14%) SNMP
13 1 (0.14%) WLAN
Database & Business Intelligence
1 16 (2.27%) SQL Server
2 6 (0.85%) Amazon RDS
3 5 (0.71%) Power BI
4 4 (0.57%) Big Data
5 3 (0.43%) Amazon Aurora
5 3 (0.43%) MySQL
5 3 (0.43%) Oracle Reports
5 3 (0.43%) SQL Server Integration Services
6 2 (0.28%) Azure SQL Database
6 2 (0.28%) BusinessObjects
6 2 (0.28%) MongoDB
6 2 (0.28%) NoSQL
7 1 (0.14%) Essbase
7 1 (0.14%) MS Access
7 1 (0.14%) Relational Database
7 1 (0.14%) SQL Server Reporting Services
Development Applications
1 17 (2.41%) Git
1 17 (2.41%) Team Foundation Server
1 17 (2.41%) Visual Studio Team System
2 4 (0.57%) JIRA
3 2 (0.28%) Visual Studio
4 1 (0.14%) Gradle
4 1 (0.14%) Postman
4 1 (0.14%) SQL Server Management Studio (SSMS)
4 1 (0.14%) Visual Studio Code
General
1 265 (37.64%) Finance
2 208 (29.55%) Social Skills
3 82 (11.65%) Social Housing
4 78 (11.08%) Public Sector
5 62 (8.81%) Local Government
6 39 (5.54%) Inclusion and Diversity
7 38 (5.40%) Retail
8 34 (4.83%) Analytical Skills
9 21 (2.98%) Organisational Skills
10 13 (1.85%) Games
11 11 (1.56%) Police
12 7 (0.99%) Influencing Skills
12 7 (0.99%) Telecoms
13 6 (0.85%) Publishing
14 5 (0.71%) Electronics
15 4 (0.57%) Legal
15 4 (0.57%) Manufacturing
15 4 (0.57%) Presentation Skills
16 3 (0.43%) Advertising
16 3 (0.43%) Social Science
Job Titles
1 148 (21.02%) Development Manager
2 132 (18.75%) Business Development Manager
2 132 (18.75%) Business Manager
3 79 (11.22%) Programmer
4 55 (7.81%) IT Support
5 53 (7.53%) Support Engineer
6 52 (7.39%) IT Engineer
7 45 (6.39%) Analyst
8 43 (6.11%) IT Support Engineer
9 32 (4.55%) Junior
10 29 (4.12%) Senior
11 22 (3.13%) IT Manager
12 21 (2.98%) Project Manager
13 19 (2.70%) Developer
14 18 (2.56%) Junior IT Engineer
14 18 (2.56%) Junior IT Support
14 18 (2.56%) Junior Support Engineer
14 18 (2.56%) Lead
15 14 (1.99%) 1st Line Engineer
15 14 (1.99%) IT Technician
Libraries, Frameworks & Software Standards
1 28 (3.98%) EDI
2 21 (2.98%) AngularJS
3 15 (2.13%) jQuery
3 15 (2.13%) Vue
4 10 (1.42%) .NET
5 7 (0.99%) .NET Framework
6 4 (0.57%) Web Services
7 3 (0.43%) JSON
7 3 (0.43%) Laravel
7 3 (0.43%) OpenMP
7 3 (0.43%) PyTorch
7 3 (0.43%) TensorFlow
8 2 (0.28%) .NET Core
8 2 (0.28%) CSS
8 2 (0.28%) HTML
8 2 (0.28%) NumPy
8 2 (0.28%) OpenID
8 2 (0.28%) OpenVINO
8 2 (0.28%) Pandas
8 2 (0.28%) scikit-learn
Miscellaneous
1 156 (22.16%) NHS
2 52 (7.39%) Driving Licence
3 34 (4.83%) Housing Association
4 31 (4.40%) PDA
5 26 (3.69%) Management Information System
6 21 (2.98%) Self-Motivation
7 11 (1.56%) Social Media
8 10 (1.42%) Grid Computing
8 10 (1.42%) Virtual Team
9 7 (0.99%) PKI
9 7 (0.99%) Security Operations Centre
9 7 (0.99%) Video Conferencing
10 6 (0.85%) CCTV
10 6 (0.85%) Educational Technology
10 6 (0.85%) Product Ownership
10 6 (0.85%) Public Cloud
11 4 (0.57%) Algorithms
11 4 (0.57%) Learning Management System
11 4 (0.57%) Smart City
12 3 (0.43%) Data Centre
Operating Systems
1 88 (12.50%) Windows
2 46 (6.53%) Windows Server
3 21 (2.98%) Windows Server 2012
4 20 (2.84%) Windows Server 2019
5 19 (2.70%) Android
6 13 (1.85%) Windows Server 2016
7 11 (1.56%) Windows Vista
8 5 (0.71%) Unix
9 4 (0.57%) Linux
10 3 (0.43%) Apple iOS
11 2 (0.28%) Windows 10
11 2 (0.28%) Windows Server 2008
12 1 (0.14%) Windows 7
12 1 (0.14%) Windows 8
12 1 (0.14%) Windows Server 2003
Processes & Methodologies
1 157 (22.30%) Service Delivery
2 152 (21.59%) Business Development
3 143 (20.31%) Financial Modelling
4 100 (14.20%) Problem-Solving
5 96 (13.64%) Customer Service
6 74 (10.51%) Project Management
7 69 (9.80%) Case Management
8 40 (5.68%) Mentoring
9 37 (5.26%) Agile
10 31 (4.40%) Decision-Making
11 29 (4.12%) Continuous Improvement
11 29 (4.12%) Line Management
11 29 (4.12%) Project Delivery
12 28 (3.98%) Computer Science
13 25 (3.55%) Programme Management
14 24 (3.41%) PRINCE2
15 21 (2.98%) Migration
16 20 (2.84%) Resource Management
17 19 (2.70%) Statistical Analysis
17 19 (2.70%) User Stories
Programming Languages
1 32 (4.55%) SQL
2 19 (2.70%) C#
3 18 (2.56%) JavaScript
4 9 (1.28%) C
5 6 (0.85%) C++
6 5 (0.71%) Python
7 4 (0.57%) Fortran
7 4 (0.57%) Julia
7 4 (0.57%) PowerShell
7 4 (0.57%) R
7 4 (0.57%) Rust
7 4 (0.57%) T-SQL
8 3 (0.43%) Assembly Language
8 3 (0.43%) Delphi
8 3 (0.43%) Pascal
8 3 (0.43%) PHP
9 2 (0.28%) Kusto Query Language
9 2 (0.28%) PL/SQL
Qualifications
1 137 (19.46%) Degree
2 67 (9.52%) BPSS Clearance
3 25 (3.55%) Security Cleared
4 16 (2.27%) Computer Science Degree
5 13 (1.85%) Cisco Certification
5 13 (1.85%) SC Cleared
6 12 (1.70%) Microsoft Certification
7 9 (1.28%) CCNA
7 9 (1.28%) Master's Degree
7 9 (1.28%) MCSE
8 8 (1.14%) HND
9 7 (0.99%) HNC
10 6 (0.85%) CCNP
10 6 (0.85%) PhD
11 3 (0.43%) Chartered Engineer
11 3 (0.43%) CISSP
12 2 (0.28%) AAT
12 2 (0.28%) PRINCE2 Certification
12 2 (0.28%) SAP Certification
12 2 (0.28%) SSCP
Quality Assurance & Compliance
1 72 (10.23%) GDPR
2 15 (2.13%) Cyber Essentials
3 13 (1.85%) QA
4 7 (0.99%) Accessibility
4 7 (0.99%) Cyber Essentials PLUS
5 4 (0.57%) ISO/IEC 27001
5 4 (0.57%) PMO
5 4 (0.57%) SLA
6 2 (0.28%) IEC 61508
7 1 (0.14%) Data Quality
7 1 (0.14%) GRC
7 1 (0.14%) ISO 9001
7 1 (0.14%) NCSC
7 1 (0.14%) NIST
System Software
1 47 (6.68%) Active Directory
2 25 (3.55%) Hyper-V
3 12 (1.70%) VMware Infrastructure
4 6 (0.85%) Virtual Desktop
5 4 (0.57%) vSphere
6 2 (0.28%) Docker
7 1 (0.14%) VMware ESXi
Systems Management
1 19 (2.70%) Microsoft Intune
2 6 (0.85%) PaperCut
2 6 (0.85%) SmoothWall
2 6 (0.85%) WSUS
3 2 (0.28%) Kubernetes
4 1 (0.14%) Docker Swarm
4 1 (0.14%) Mesos
4 1 (0.14%) Progress Chef
4 1 (0.14%) SCCM
4 1 (0.14%) Terraform
4 1 (0.14%) vCenter Server
Vendors
1 95 (13.49%) Microsoft
2 27 (3.84%) Sun
3 23 (3.27%) VMware
4 12 (1.70%) Cisco
5 10 (1.42%) Google
6 7 (0.99%) ESET
6 7 (0.99%) Meraki
7 6 (0.85%) Oracle
8 5 (0.71%) Apple
8 5 (0.71%) F5
8 5 (0.71%) HP
8 5 (0.71%) SAP
9 4 (0.57%) Aruba
9 4 (0.57%) CheckPoint
9 4 (0.57%) ServiceNow
10 2 (0.28%) Dell
10 2 (0.28%) Mitel
10 2 (0.28%) NEC
10 2 (0.28%) NetApp
10 2 (0.28%) TOWER Software