ISO/IEC 27001
UK

The following table provides summary statistics for permanent job vacancies with a requirement for ISO/IEC 27001 skills. Included is a benchmarking guide to the salaries offered in vacancies that have cited ISO/IEC 27001 over the 6 months to 10 December 2023 with a comparison to the same period in the previous 2 years.

6 months to
10 Dec 2023
Same period 2022 Same period 2021
Rank 157 234 228
Rank change year-on-year +77 -6 -38
Permanent jobs citing ISO/IEC 27001 1,150 1,982 2,079
As % of all permanent jobs advertised in the UK 2.20% 1.62% 1.64%
As % of the Quality Assurance & Compliance category 14.89% 9.12% 10.48%
Number of salaries quoted 918 1,487 1,639
10th Percentile £41,250 £38,161 £36,250
25th Percentile £48,049 £50,000 £43,750
Median annual salary (50th Percentile) £60,500 £60,000 £60,000
Median % change year-on-year +0.83% - -
75th Percentile £77,500 £78,000 £73,750
90th Percentile £92,150 £95,000 £87,500
UK excluding London median annual salary £55,000 £55,000 £52,500
% change year-on-year - +4.76% -

All Quality Assurance and Compliance Skills
UK

ISO/IEC 27001 is in the Quality Assurance and Compliance category. The following table is for comparison with the above and provides summary statistics for all permanent job vacancies with a requirement for quality assurance or compliance skills.

Permanent vacancies with a requirement for quality assurance or compliance skills 7,723 21,738 19,840
As % of all permanent jobs advertised in the UK 14.77% 17.78% 15.61%
Number of salaries quoted 5,686 11,782 12,692
10th Percentile £31,250 £31,250 £31,000
25th Percentile £42,500 £42,500 £40,500
Median annual salary (50th Percentile) £60,000 £57,500 £55,000
Median % change year-on-year +4.35% +4.55% +2.80%
75th Percentile £77,500 £76,250 £72,500
90th Percentile £95,000 £95,000 £90,000
UK excluding London median annual salary £52,500 £50,000 £47,500
% change year-on-year +5.00% +5.26% -3.06%

ISO/IEC 27001
Job Vacancy Trend

Job postings citing ISO/IEC 27001 as a proportion of all IT jobs advertised.
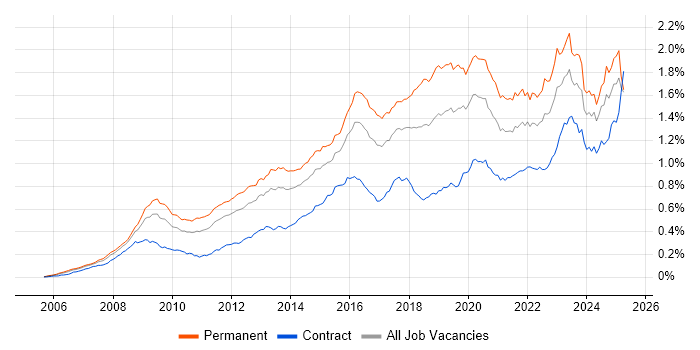
Job vacancy trend for ISO/IEC 27001 in the UK

ISO/IEC 27001
Salary Trend

3-month moving average salary quoted in jobs citing ISO/IEC 27001.

Salary trend for ISO/IEC 27001 in the UK

ISO/IEC 27001
Salary Histogram

Salary distribution for jobs citing ISO/IEC 27001 over the 6 months to 10 December 2023.

Salary histogram for ISO/IEC 27001 in the UK

ISO/IEC 27001
Top 18 Job Locations

The table below looks at the demand and provides a guide to the median salaries quoted in IT jobs citing ISO/IEC 27001 within the UK over the 6 months to 10 December 2023. The 'Rank Change' column provides an indication of the change in demand within each location based on the same 6 month period last year.

Location Rank Change
on Same Period
Last Year
Matching
Permanent
IT Job Ads
Median Salary
Past 6 Months
Median Salary
% Change
on Same Period
Last Year
Live
Jobs
England +79 1,009 £62,500 +4.17% 472
UK excluding London +94 710 £55,000 - 300
Work from Home +67 554 £60,500 +0.83% 230
London +64 380 £70,000 +3.70% 192
North of England +87 167 £50,000 -4.76% 60
South East +49 158 £60,000 +4.35% 101
South West +78 123 £60,000 +9.09% 49
Midlands +97 122 £55,000 -1.79% 36
West Midlands +87 87 £55,000 -4.35% 26
Yorkshire +103 84 £55,750 -7.08% 25
North West +51 77 £47,500 -1.04% 26
Scotland +71 52 £51,250 -15.98% 24
East of England +108 44 £72,500 +31.82% 32
East Midlands +61 32 £55,000 - 10
Wales +15 30 £45,000 -1.10% 7
Northern Ireland +39 13 £39,000 -37.60% 1
North East +24 6 £45,000 +28.57% 11
Channel Islands - 2 £55,000 -

ISO/IEC 27001
Co-occurring Skills and Capabilities by Category

The follow tables expand on the table above by listing co-occurrences grouped by category. The same employment type, locality and period is covered with up to 20 co-occurrences shown in each of the following categories:

Application Platforms
1 38 (3.30%) SharePoint
2 19 (1.65%) IIS
3 9 (0.78%) Confluence
4 8 (0.70%) CMS
5 7 (0.61%) MS Exchange
6 3 (0.26%) Apache
7 2 (0.17%) Drupal
7 2 (0.17%) WordPress
8 1 (0.087%) nginx
8 1 (0.087%) OpenStack
8 1 (0.087%) SAS
8 1 (0.087%) WebSphere
Applications
1 55 (4.78%) Microsoft Office
2 30 (2.61%) Microsoft Excel
3 20 (1.74%) Microsoft PowerPoint
4 6 (0.52%) Adobe XD
4 6 (0.52%) Sketch
5 3 (0.26%) 1Password
5 3 (0.26%) MS Visio
6 2 (0.17%) Trello
7 1 (0.087%) Microsoft Project
7 1 (0.087%) Revit
7 1 (0.087%) SOLIDWORKS
Business Applications
1 8 (0.70%) Dynamics CRM
2 7 (0.61%) BusinessWorks
3 6 (0.52%) Sparx Enterprise Architect
4 1 (0.087%) Elite 3E
4 1 (0.087%) SAP Business One
4 1 (0.087%) SAP S/4HANA
Cloud Services
1 285 (24.78%) Azure
2 142 (12.35%) Microsoft 365
3 102 (8.87%) AWS
4 60 (5.22%) Entra ID
5 44 (3.83%) SaaS
6 41 (3.57%) Azure Sentinel
7 39 (3.39%) IaaS
8 36 (3.13%) PaaS
9 34 (2.96%) Power Platform
10 29 (2.52%) GCP
11 24 (2.09%) Cloud Computing
12 16 (1.39%) Azure DevOps
13 15 (1.30%) Power Automate
14 14 (1.22%) Microsoft Purview
15 12 (1.04%) PowerApps
16 10 (0.87%) OneDrive
17 9 (0.78%) Azure AKS
18 8 (0.70%) Cloudflare
18 8 (0.70%) Mimecast
19 7 (0.61%) Azure Monitor
Communications & Networking
1 224 (19.48%) Firewall
2 106 (9.22%) Intrusion Detection
3 105 (9.13%) Network Security
4 101 (8.78%) LAN
5 97 (8.43%) WAN
6 58 (5.04%) VPN
7 51 (4.43%) Wireless
8 37 (3.22%) TCP/IP
9 34 (2.96%) DNS
10 21 (1.83%) DHCP
11 17 (1.48%) SAN
12 12 (1.04%) VLAN
13 11 (0.96%) Internet
14 10 (0.87%) Cisco IPT
15 9 (0.78%) Wi-Fi
16 8 (0.70%) BGP
16 8 (0.70%) SD-WAN
16 8 (0.70%) Wireshark
17 7 (0.61%) IPv6
17 7 (0.61%) VoIP
Database & Business Intelligence
1 46 (4.00%) SQL Server
2 26 (2.26%) Power BI
3 10 (0.87%) SQL Server Integration Services
4 9 (0.78%) SQL Server Reporting Services
5 6 (0.52%) Redis
6 5 (0.43%) Azure SQL Database
6 5 (0.43%) GIS
7 3 (0.26%) Data Lake
7 3 (0.26%) MySQL
8 2 (0.17%) Amazon RDS
8 2 (0.17%) Data Hub
8 2 (0.17%) MariaDB
8 2 (0.17%) MongoDB
8 2 (0.17%) NoSQL
8 2 (0.17%) PostgreSQL
8 2 (0.17%) Relational Database
9 1 (0.087%) DocumentDB
9 1 (0.087%) DTS
9 1 (0.087%) Firebird
9 1 (0.087%) SAP BW
Development Applications
1 20 (1.74%) JIRA
2 15 (1.30%) Git
3 11 (0.96%) Jenkins
4 6 (0.52%) GitLab
4 6 (0.52%) Team Foundation Server
4 6 (0.52%) TeamCity
5 4 (0.35%) Burp Suite
5 4 (0.35%) NUnit
5 4 (0.35%) Octopus Deploy
5 4 (0.35%) Sonatype Nexus
6 3 (0.26%) Subversion
7 2 (0.17%) Metasploit
7 2 (0.17%) Visual Studio
7 2 (0.17%) Visual Studio Code
8 1 (0.087%) Bitbucket
8 1 (0.087%) DBeaver
8 1 (0.087%) git-flow
8 1 (0.087%) MSI
8 1 (0.087%) SonarQube
General
1 366 (31.83%) Social Skills
2 181 (15.74%) Finance
3 109 (9.48%) Public Sector
4 105 (9.13%) Analytical Skills
5 77 (6.70%) Legal
6 75 (6.52%) Law
7 64 (5.57%) Games
8 43 (3.74%) Inclusion and Diversity
9 39 (3.39%) Retail
10 38 (3.30%) Telecoms
11 24 (2.09%) Organisational Skills
12 22 (1.91%) Marketing
13 20 (1.74%) Manufacturing
13 20 (1.74%) Military
14 19 (1.65%) Banking
15 18 (1.57%) Advertising
16 17 (1.48%) Influencing Skills
17 15 (1.30%) Presentation Skills
18 10 (0.87%) Documentation Skills
19 8 (0.70%) Automotive
Job Titles
1 183 (15.91%) Analyst
2 166 (14.43%) Security Manager
3 153 (13.30%) Senior
4 137 (11.91%) Security Analyst
5 87 (7.57%) Consultant
6 83 (7.22%) Lead
6 83 (7.22%) Security Engineer
7 72 (6.26%) Senior Manager
8 65 (5.65%) IT Manager
9 63 (5.48%) Business Manager
10 60 (5.22%) Security Consultant
10 60 (5.22%) Senior Business Manager
11 56 (4.87%) Information Analyst
12 55 (4.78%) Information Manager
12 55 (4.78%) Information Security Analyst
13 54 (4.70%) Architect
14 48 (4.17%) Information Security Manager
14 48 (4.17%) Security Officer
15 43 (3.74%) Infrastructure Engineer
16 42 (3.65%) Security Specialist
Libraries, Frameworks & Software Standards
1 47 (4.09%) ModSecurity
2 22 (1.91%) .NET
2 22 (1.91%) REST
2 22 (1.91%) Web Services
3 16 (1.39%) .NET Framework
4 14 (1.22%) HTML
5 13 (1.13%) ASP.NET
5 13 (1.13%) HTML5
6 11 (0.96%) .NET Core
6 11 (0.96%) Entity Framework
6 11 (0.96%) JSON
6 11 (0.96%) SOAP
7 10 (0.87%) ASP.NET MVC
7 10 (0.87%) Middleware
8 9 (0.78%) AngularJS
8 9 (0.78%) OAuth
9 8 (0.70%) Node.js
10 7 (0.61%) ASP.NET Web API
10 7 (0.61%) Twitter Bootstrap
11 6 (0.52%) HTML5 Canvas
Miscellaneous
1 208 (18.09%) Management Information System
2 87 (7.57%) Security Operations Centre
3 83 (7.22%) Security Posture
4 59 (5.13%) Greenfield Project
5 51 (4.43%) Data Centre
6 49 (4.26%) PKI
7 38 (3.30%) Cyberattack
8 37 (3.22%) Cyber Threat
8 37 (3.22%) Self-Motivation
9 31 (2.70%) Operational Technology
10 28 (2.43%) Data Protection Act
11 25 (2.17%) Driving Licence
12 22 (1.91%) Onboarding
13 14 (1.22%) Product Ownership
13 14 (1.22%) Public Cloud
14 13 (1.13%) CESG
14 13 (1.13%) Cloud Native
15 11 (0.96%) e-Learning
15 11 (0.96%) Legacy Systems
16 9 (0.78%) Mobile App
Operating Systems
1 236 (20.52%) Windows
2 84 (7.30%) Linux
3 74 (6.43%) Unix
4 70 (6.09%) Windows Server
5 27 (2.35%) Windows 10
6 21 (1.83%) Windows Server 2016
7 17 (1.48%) Windows Server 2019
8 16 (1.39%) Windows Server 2003
9 14 (1.22%) Mac OS
10 7 (0.61%) Apple iOS
11 5 (0.43%) Mac OS X
11 5 (0.43%) Windows Server 2012
12 4 (0.35%) Android
12 4 (0.35%) VMS
13 2 (0.17%) CentOS
13 2 (0.17%) Kali Linux
14 1 (0.087%) Ubuntu
14 1 (0.087%) Windows Server 2008
Processes & Methodologies
1 600 (52.17%) Cybersecurity
2 551 (47.91%) Information Security
3 248 (21.57%) SIEM
4 238 (20.70%) Security Management
5 216 (18.78%) Risk Management
6 174 (15.13%) Vulnerability Scanning
7 167 (14.52%) Security Operations
8 166 (14.43%) Vulnerability Management
9 162 (14.09%) Business Continuity
10 158 (13.74%) ITIL
11 151 (13.13%) Information Security Management
12 139 (12.09%) ISMS
13 136 (11.83%) Incident Response
14 133 (11.57%) Data Protection
14 133 (11.57%) Problem-Solving
15 114 (9.91%) Incident Management
16 104 (9.04%) Cloud Security
17 100 (8.70%) Penetration Testing
18 85 (7.39%) Service Management
19 81 (7.04%) Security Architecture
Programming Languages
1 72 (6.26%) PowerShell
2 50 (4.35%) Python
3 49 (4.26%) SQL
4 42 (3.65%) C#
5 38 (3.30%) Bash
6 31 (2.70%) JavaScript
7 14 (1.22%) Kusto Query Language
8 10 (0.87%) Java
9 9 (0.78%) Ruby
9 9 (0.78%) TypeScript
10 6 (0.52%) T-SQL
11 4 (0.35%) Go
12 2 (0.17%) C++
12 2 (0.17%) Perl
12 2 (0.17%) PHP
12 2 (0.17%) Shell Script
12 2 (0.17%) VB.NET
13 1 (0.087%) ABAP
13 1 (0.087%) C
13 1 (0.087%) VBScript
Qualifications
1 362 (31.48%) CISSP
2 274 (23.83%) CISM
3 232 (20.17%) Degree
4 221 (19.22%) Security Cleared
5 142 (12.35%) CISA
6 88 (7.65%) CRISC
7 79 (6.87%) SC Cleared
8 73 (6.35%) SSCP
9 61 (5.30%) Master's Degree
10 56 (4.87%) CEH
10 56 (4.87%) Cisco Certification
11 40 (3.48%) CompTIA Security+
12 39 (3.39%) Computer Science Degree
13 35 (3.04%) (ISC)2 CCSP
14 32 (2.78%) GIAC
15 31 (2.70%) GCIH
16 30 (2.61%) CCSP
16 30 (2.61%) ISO 27001 Lead Auditor
16 30 (2.61%) OSCP
17 28 (2.43%) GCIA
Quality Assurance & Compliance
1 371 (32.26%) NIST
2 246 (21.39%) GDPR
3 242 (21.04%) Cyber Essentials
4 171 (14.87%) PCI DSS
5 149 (12.96%) GRC
6 104 (9.04%) Cyber Essentials PLUS
7 73 (6.35%) ISO 9001
8 71 (6.17%) NCSC
9 62 (5.39%) ISO 22301
10 53 (4.61%) HMG Security Policy Framework
11 46 (4.00%) COBIT
12 36 (3.13%) SOC 2
13 31 (2.70%) ISO/IEC 27002 (supersedes ISO/IEC 17799)
14 27 (2.35%) SLA
15 22 (1.91%) NIST 800
16 21 (1.83%) RMADS
16 21 (1.83%) Sarbanes-Oxley
17 19 (1.65%) ISO/IEC 17025
18 17 (1.48%) ISO/IEC 20000
19 16 (1.39%) JSP 440
System Software
1 107 (9.30%) Active Directory
2 52 (4.52%) VMware Infrastructure
3 33 (2.87%) Hyper-V
4 23 (2.00%) Docker
5 19 (1.65%) Firmware
6 15 (1.30%) vSphere
7 9 (0.78%) Virtual Desktop
8 7 (0.61%) Virtual Machines
9 4 (0.35%) VMware ESXi
10 3 (0.26%) KVM
11 2 (0.17%) Citrix Hypervisor
12 1 (0.087%) BitLocker
12 1 (0.087%) Microsoft Virtual Server
12 1 (0.087%) QEMU
12 1 (0.087%) Terminal Services
12 1 (0.087%) Virtual Servers
Systems Management
1 38 (3.30%) Kubernetes
2 35 (3.04%) Microsoft Intune
3 23 (2.00%) Terraform
4 20 (1.74%) SCCM
5 19 (1.65%) EnCase
6 15 (1.30%) Nessus
7 13 (1.13%) Ansible
7 13 (1.13%) CASB
8 7 (0.61%) Puppet
8 7 (0.61%) Single Sign-On
9 5 (0.43%) CSIRT
9 5 (0.43%) HP Fortify
9 5 (0.43%) Nmap
9 5 (0.43%) ZABBIX
10 4 (0.35%) Backup Exec
10 4 (0.35%) Jamf Pro
10 4 (0.35%) Progress Chef
11 3 (0.26%) Active Directory Federation Services
12 2 (0.17%) Cacti
12 2 (0.17%) Grafana
Vendors
1 280 (24.35%) Microsoft
2 94 (8.17%) VMware
3 73 (6.35%) Cisco
4 41 (3.57%) CA
5 23 (2.00%) Google
6 22 (1.91%) Palo Alto
7 17 (1.48%) Remedy
7 17 (1.48%) ServiceNow
8 16 (1.39%) Meraki
8 16 (1.39%) Splunk
9 15 (1.30%) HP
10 14 (1.22%) Citrix
11 11 (0.96%) SolarWinds
12 10 (0.87%) Dell
13 9 (0.78%) Apple
13 9 (0.78%) Cadence
13 9 (0.78%) Sophos
14 8 (0.70%) Adobe
14 8 (0.70%) Fortinet
14 8 (0.70%) SAP