Greenfield Project
UK

The table below looks at the prevalence of the term Greenfield Project in permanent job vacancies. Included is a benchmarking guide to the salaries offered in vacancies that have cited Greenfield Project over the 6 months to 10 December 2023 with a comparison to the same period over the previous 2 years.

6 months to
10 Dec 2023
Same period 2022 Same period 2021
Rank 192 175 95
Rank change year-on-year -17 -80 -6
Permanent jobs citing Greenfield Project 974 2,677 4,401
As % of all permanent jobs advertised in the UK 1.86% 2.19% 3.46%
As % of the Miscellaneous category 5.06% 5.10% 7.91%
Number of salaries quoted 854 2,364 3,882
10th Percentile £42,500 £42,500 £40,000
25th Percentile £56,250 £50,000 £47,500
Median annual salary (50th Percentile) £77,500 £70,000 £67,500
Median % change year-on-year +10.71% +3.70% +12.50%
75th Percentile £100,000 £90,000 £87,500
90th Percentile £130,000 £107,500 £112,500
UK excluding London median annual salary £57,500 £60,000 £60,000
% change year-on-year -4.17% - +20.00%

All Generic Skills
UK

Greenfield Project is in the General and Transferable Skills category. The following table is for comparison with the above and provides summary statistics for all permanent job vacancies with a requirement for generic IT skills.

Permanent vacancies with a requirement for generic IT skills 19,243 52,473 55,657
As % of all permanent jobs advertised in the UK 36.81% 42.93% 43.80%
Number of salaries quoted 14,017 29,568 33,811
10th Percentile £32,756 £34,996 £33,750
25th Percentile £45,000 £46,250 £45,000
Median annual salary (50th Percentile) £62,500 £64,750 £60,000
Median % change year-on-year -3.47% +7.92% -
75th Percentile £83,750 £85,000 £82,500
90th Percentile £107,500 £105,000 £100,000
UK excluding London median annual salary £55,000 £55,000 £50,000
% change year-on-year - +10.00% -

Greenfield Project
Job Vacancy Trend

Job postings citing Greenfield Project as a proportion of all IT jobs advertised.
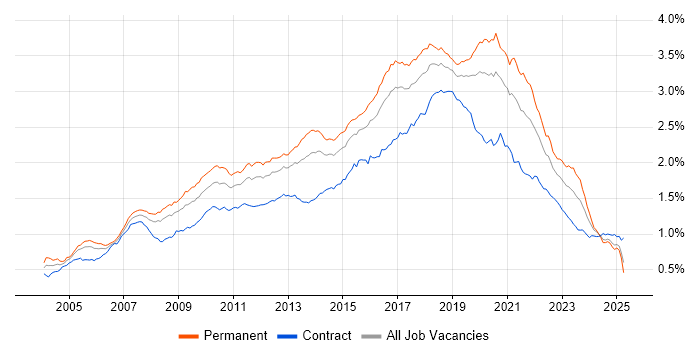
Job vacancy trend for Greenfield Project in the UK

Greenfield Project
Salary Trend

3-month moving average salary quoted in jobs citing Greenfield Project.

Salary trend for Greenfield Project in the UK

Greenfield Project
Salary Histogram

Salary distribution for jobs citing Greenfield Project over the 6 months to 10 December 2023.

Salary histogram for Greenfield Project in the UK

Greenfield Project
Top 17 Job Locations

The table below looks at the demand and provides a guide to the median salaries quoted in IT jobs citing Greenfield Project within the UK over the 6 months to 10 December 2023. The 'Rank Change' column provides an indication of the change in demand within each location based on the same 6 month period last year.

Location Rank Change
on Same Period
Last Year
Matching
Permanent
IT Job Ads
Median Salary
Past 6 Months
Median Salary
% Change
on Same Period
Last Year
Live
Jobs
England -12 861 £80,000 +10.34% 486
Work from Home -29 557 £70,000 - 366
London +27 540 £95,000 +11.76% 244
UK excluding London -57 371 £57,500 -4.17% 296
North of England -16 92 £60,000 - 92
South East -57 84 £62,500 - 81
Scotland +12 52 £65,000 +18.18% 15
Yorkshire +23 48 £60,000 +9.09% 25
South West -12 47 £53,750 -6.52% 12
Midlands +19 42 £53,750 -6.52% 53
East of England +119 39 £50,000 -13.04% 20
North West +14 37 £56,250 -6.25% 63
East Midlands +27 22 £62,500 -1.96% 19
West Midlands +36 20 £50,000 -9.09% 33
Northern Ireland +15 10 £87,500 +16.67% 12
North East +4 7 £47,500 -32.14% 4
Wales +3 7 £53,750 +5.39% 12

Greenfield Project
Co-occurring Skills and Capabilities by Category

The follow tables expand on the table above by listing co-occurrences grouped by category. The same employment type, locality and period is covered with up to 20 co-occurrences shown in each of the following categories:

Application Platforms
1 14 (1.44%) Apache Spark
2 13 (1.33%) Confluence
3 7 (0.72%) Apache Airflow
4 5 (0.51%) IBM HTTP Server
4 5 (0.51%) SharePoint
5 4 (0.41%) Apache
6 3 (0.31%) nginx
7 2 (0.21%) Apache Solr
7 2 (0.21%) CMS
7 2 (0.21%) IIS
7 2 (0.21%) MQSeries
7 2 (0.21%) MS Exchange
7 2 (0.21%) SAS
7 2 (0.21%) Tomcat
7 2 (0.21%) WordPress
8 1 (0.10%) Ethereum
Applications
1 6 (0.62%) Microsoft Office
2 3 (0.31%) Sketch
3 2 (0.21%) Microsoft Excel
3 2 (0.21%) Microsoft PowerPoint
3 2 (0.21%) Oracle Smart View
3 2 (0.21%) UXPin
3 2 (0.21%) Zeplin
4 1 (0.10%) Adobe XD
4 1 (0.10%) Photoshop
Business Applications
1 13 (1.33%) Payment Gateway
2 6 (0.62%) SAP S/4HANA
3 5 (0.51%) Dynamics CRM
4 2 (0.21%) SAP ERP
4 2 (0.21%) SAP FI
4 2 (0.21%) SAP SCM
5 1 (0.10%) Distributed Ledger
5 1 (0.10%) Elite 3E
5 1 (0.10%) Magento
5 1 (0.10%) SAP CO
5 1 (0.10%) SAP CS
5 1 (0.10%) SAP EWM
5 1 (0.10%) SAP FI/CO
5 1 (0.10%) SAP PM
5 1 (0.10%) SAP PP
5 1 (0.10%) SAP SM
5 1 (0.10%) SAP WM
Cloud Services
1 253 (25.98%) Azure
2 219 (22.48%) AWS
3 101 (10.37%) GCP
4 76 (7.80%) SaaS
5 46 (4.72%) Azure DevOps
6 41 (4.21%) Serverless
7 32 (3.29%) Power Platform
8 31 (3.18%) GitHub
9 25 (2.57%) WhatsApp
10 24 (2.46%) AWS Lambda
11 20 (2.05%) Amazon S3
12 15 (1.54%) GitHub Actions
13 14 (1.44%) AWS CloudFormation
14 13 (1.33%) Microsoft 365
14 13 (1.33%) Snowflake
15 10 (1.03%) Azure AKS
15 10 (1.03%) Entra ID
16 9 (0.92%) PowerApps
17 8 (0.82%) Azure Functions
17 8 (0.82%) Cloud Computing
Communications & Networking
1 7 (0.72%) DNS
1 7 (0.72%) Firewall
1 7 (0.72%) PBX
1 7 (0.72%) VoIP
2 3 (0.31%) Ethernet
2 3 (0.31%) Internet
2 3 (0.31%) Unified Communications
2 3 (0.31%) VLAN
3 2 (0.21%) Network Security
3 2 (0.21%) WPA
4 1 (0.10%) Broadband
4 1 (0.10%) SAN
4 1 (0.10%) SSL
Database & Business Intelligence
1 59 (6.06%) SQL Server
2 28 (2.87%) PostgreSQL
3 26 (2.67%) Data Warehouse
4 22 (2.26%) MySQL
5 21 (2.16%) Power BI
6 19 (1.95%) Big Data
7 14 (1.44%) Hadoop
8 13 (1.33%) Relational Database
9 12 (1.23%) DynamoDB
9 12 (1.23%) Redis
10 11 (1.13%) MongoDB
10 11 (1.13%) SQL Server Reporting Services
11 9 (0.92%) Data Lake
12 8 (0.82%) BigQuery
12 8 (0.82%) NoSQL
13 7 (0.72%) Azure SQL Database
13 7 (0.72%) KDB
14 6 (0.62%) Amazon Redshift
15 5 (0.51%) Amazon RDS
15 5 (0.51%) Apache Hive
Development Applications
1 41 (4.21%) Git
2 40 (4.11%) Jenkins
3 28 (2.87%) JIRA
4 17 (1.75%) webpack
5 16 (1.64%) Visual Studio
6 15 (1.54%) GitLab
6 15 (1.54%) Selenium
7 12 (1.23%) SpecFlow
8 10 (1.03%) Postman
8 10 (1.03%) TeamCity
9 9 (0.92%) Gatling
9 9 (0.92%) JMeter
10 8 (0.82%) Bitbucket
11 6 (0.62%) CircleCI
11 6 (0.62%) Cucumber
12 5 (0.51%) Gradle
12 5 (0.51%) Moq
13 4 (0.41%) eggPlant
13 4 (0.41%) Maven
13 4 (0.41%) Team Foundation Server
General
1 222 (22.79%) Finance
2 182 (18.69%) Social Skills
3 106 (10.88%) Analytical Skills
4 89 (9.14%) Front Office
5 52 (5.34%) Banking
6 42 (4.31%) Legal
7 38 (3.90%) Inclusion and Diversity
8 37 (3.80%) Retail
9 19 (1.95%) Influencing Skills
10 15 (1.54%) Presentation Skills
11 14 (1.44%) Tech for Good
12 12 (1.23%) Health Technology
13 10 (1.03%) Games
13 10 (1.03%) Pharmaceutical
14 9 (0.92%) Investment Banking
14 9 (0.92%) Marketing
14 9 (0.92%) Telecoms
15 8 (0.82%) Law
15 8 (0.82%) Public Sector
16 6 (0.62%) Manufacturing
Job Titles
1 429 (44.05%) Developer
2 179 (18.38%) Senior
3 121 (12.42%) Lead
4 119 (12.22%) Software Engineer
5 96 (9.86%) Java Developer
6 85 (8.73%) .NET Developer
6 85 (8.73%) Senior Developer
7 73 (7.49%) Software Developer
8 47 (4.83%) Full Stack Developer
9 42 (4.31%) Analyst
9 42 (4.31%) C# Developer
10 40 (4.11%) C# Software Engineer
11 38 (3.90%) Site Controller
12 37 (3.80%) Data Engineer
13 34 (3.49%) Architect
13 34 (3.49%) DevOps Engineer
14 33 (3.39%) C# .NET Developer
15 31 (3.18%) Lead Software Engineer
16 26 (2.67%) Lead Developer
16 26 (2.67%) Python Developer
Libraries, Frameworks & Software Standards
1 187 (19.20%) .NET
2 173 (17.76%) React
3 76 (7.80%) CSS
4 74 (7.60%) .NET Core
5 70 (7.19%) REST
6 67 (6.88%) HTML
7 55 (5.65%) Spring
8 51 (5.24%) AngularJS
9 44 (4.52%) .NET Framework
9 44 (4.52%) Vue
10 42 (4.31%) Spring Boot
11 38 (3.90%) ModSecurity
11 38 (3.90%) Node.js
12 37 (3.80%) ASP.NET Web API
13 36 (3.70%) Kafka
14 34 (3.49%) GraphQL
14 34 (3.49%) RESTful
15 30 (3.08%) Qt
16 28 (2.87%) ASP.NET
17 20 (2.05%) Web Services
Miscellaneous
1 42 (4.31%) Management Information System
2 35 (3.59%) Fixed Income
3 31 (3.18%) Cloud Native
4 29 (2.98%) Product Ownership
5 27 (2.77%) Mobile App
6 24 (2.46%) Hedge funds
7 19 (1.95%) Foreign Exchange (FX)
8 17 (1.75%) Private Cloud
9 16 (1.64%) Derivative
10 15 (1.54%) Distributed Systems
11 10 (1.03%) Data Centre
12 9 (0.92%) Social Network
13 8 (0.82%) Data Structures
13 8 (0.82%) Equities
13 8 (0.82%) Hackathon
13 8 (0.82%) Life Science
14 7 (0.72%) Enterprise Software
14 7 (0.72%) Legacy Systems
15 6 (0.62%) Algorithms
15 6 (0.62%) Public Cloud
Operating Systems
1 32 (3.29%) Windows
2 30 (3.08%) Linux
3 17 (1.75%) Android
4 16 (1.64%) Apple iOS
5 9 (0.92%) Windows Server
6 6 (0.62%) Red Hat Enterprise Linux
7 5 (0.51%) Windows 10
8 4 (0.41%) Unix
9 1 (0.10%) Debian
9 1 (0.10%) Ubuntu
Processes & Methodologies
1 257 (26.39%) Agile
2 232 (23.82%) Software Engineering
3 169 (17.35%) DevOps
4 157 (16.12%) Computer Science
5 137 (14.07%) Fintech
6 131 (13.45%) CI/CD
7 116 (11.91%) Microservices
8 97 (9.96%) Full Stack Development
9 93 (9.55%) Problem-Solving
10 82 (8.42%) Mentoring
11 76 (7.80%) Front End Development
12 71 (7.29%) Low Latency
13 56 (5.75%) Information Security
13 56 (5.75%) Roadmaps
13 56 (5.75%) User Experience
14 55 (5.65%) SDLC
15 53 (5.44%) Scrum
16 52 (5.34%) ISMS
17 45 (4.62%) Analytics
18 43 (4.41%) Risk Management
Programming Languages
1 217 (22.28%) C#
2 193 (19.82%) Java
3 160 (16.43%) JavaScript
4 139 (14.27%) Python
5 136 (13.96%) SQL
6 107 (10.99%) TypeScript
7 75 (7.70%) C++
8 40 (4.11%) PowerShell
9 33 (3.39%) Kotlin
9 33 (3.39%) PHP
10 25 (2.57%) C
11 18 (1.85%) Go
11 18 (1.85%) Scala
12 14 (1.44%) Ruby
13 8 (0.82%) T-SQL
14 7 (0.72%) Bash
15 5 (0.51%) PL/SQL
15 5 (0.51%) R
16 4 (0.41%) Data Analysis Expressions
16 4 (0.41%) Rust
Qualifications
1 221 (22.69%) Degree
2 69 (7.08%) Computer Science Degree
3 55 (5.65%) Security Cleared
4 39 (4.00%) CISA
4 39 (4.00%) CISM
4 39 (4.00%) CISSP
5 38 (3.90%) CRISC
6 15 (1.54%) SC Cleared
7 13 (1.33%) Master's Degree
8 9 (0.92%) PhD
9 8 (0.82%) Microsoft Certification
10 6 (0.62%) ITIL Certification
11 5 (0.51%) ISEB
11 5 (0.51%) ISTQB
12 4 (0.41%) Azure Certification
12 4 (0.41%) DV Cleared
13 2 (0.21%) MBA
14 1 (0.10%) MCSE
14 1 (0.10%) PMI Certification
14 1 (0.10%) SAP Certification
Quality Assurance & Compliance
1 59 (6.06%) ISO/IEC 27001
2 55 (5.65%) NIST
3 54 (5.54%) GRC
4 37 (3.80%) ISO 22301
5 31 (3.18%) Accessibility
6 24 (2.46%) QA
7 20 (2.05%) Data Quality
8 17 (1.75%) GDPR
9 13 (1.33%) WCAG
10 1 (0.10%) Cyber Essentials
10 1 (0.10%) Cyber Essentials PLUS
10 1 (0.10%) Government Security Classifications
System Software
1 105 (10.78%) Docker
2 15 (1.54%) Active Directory
3 5 (0.51%) VMware Infrastructure
4 4 (0.41%) Virtual Machines
5 2 (0.21%) HDFS
6 1 (0.10%) Firmware
Systems Management
1 122 (12.53%) Kubernetes
2 83 (8.52%) Terraform
3 26 (2.67%) Ansible
4 10 (1.03%) Progress Chef
4 10 (1.03%) Puppet
5 8 (0.82%) Grafana
6 7 (0.72%) Microsoft Intune
6 7 (0.72%) Packer
7 4 (0.41%) Fortio
7 4 (0.41%) Istio
7 4 (0.41%) Kiali
7 4 (0.41%) Kibana
7 4 (0.41%) SCCM
8 3 (0.31%) Prometheus
9 2 (0.21%) BMC PATROL
Vendors
1 59 (6.06%) Microsoft
2 44 (4.52%) Google
3 37 (3.80%) CA
4 30 (3.08%) Databricks
5 9 (0.92%) SAP
6 7 (0.72%) Oracle
6 7 (0.72%) Salesforce
7 6 (0.62%) Red Hat
7 6 (0.62%) VMware
8 5 (0.51%) Alteryx
8 5 (0.51%) GoldenSource
9 4 (0.41%) ServiceNow
10 3 (0.31%) Apple
10 3 (0.31%) Veeam
11 2 (0.21%) Atlassian
11 2 (0.21%) Cloudera
11 2 (0.21%) Sage
11 2 (0.21%) Solace
11 2 (0.21%) StreamSets
11 2 (0.21%) TIBCO