Microsoft Visual Studio
UK

The following table provides summary statistics for permanent job vacancies with a requirement for Visual Studio skills. Included is a benchmarking guide to the salaries offered in vacancies that have cited Visual Studio over the 6 months to 10 December 2023 with a comparison to the same period in the previous 2 years.

6 months to
10 Dec 2023
Same period 2022 Same period 2021
Rank 400 402 332
Rank change year-on-year +2 -70 -66
Permanent jobs citing Visual Studio 367 971 1,395
As % of all permanent jobs advertised in the UK 0.70% 0.79% 1.10%
As % of the Development Applications category 5.36% 4.45% 5.41%
Number of salaries quoted 323 805 1,072
10th Percentile £31,500 £37,500 £35,745
25th Percentile £42,500 £45,000 £38,750
Median annual salary (50th Percentile) £52,500 £55,000 £50,000
Median % change year-on-year -4.55% +10.00% +5.26%
75th Percentile £66,250 £67,500 £65,000
90th Percentile £80,000 £84,600 £77,500
UK excluding London median annual salary £47,500 £50,000 £47,500
% change year-on-year -5.00% +5.26% +5.56%

All Development Application Skills
UK

Visual Studio is in the Development Applications category. The following table is for comparison with the above and provides summary statistics for all permanent job vacancies with a requirement for development application skills.

Permanent vacancies with a requirement for development application skills 6,842 21,844 25,769
As % of all permanent jobs advertised in the UK 13.09% 17.87% 20.28%
Number of salaries quoted 5,216 12,549 16,287
10th Percentile £41,250 £39,750 £36,750
25th Percentile £50,000 £48,750 £45,000
Median annual salary (50th Percentile) £65,000 £65,000 £60,000
Median % change year-on-year - +8.33% +9.09%
75th Percentile £82,548 £82,500 £76,000
90th Percentile £100,000 £100,000 £91,250
UK excluding London median annual salary £58,000 £55,000 £50,000
% change year-on-year +5.45% +10.00% -

Visual Studio
Job Vacancy Trend

Job postings citing Visual Studio as a proportion of all IT jobs advertised.
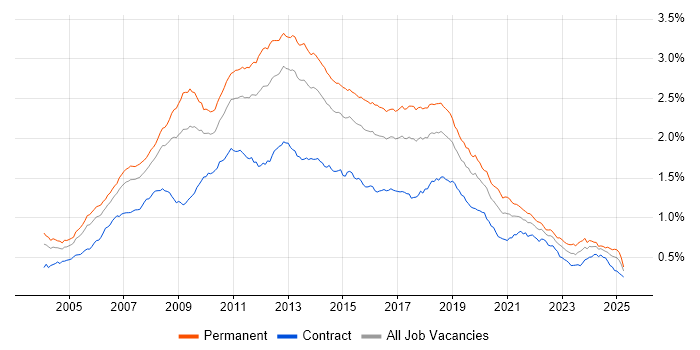
Job vacancy trend for Visual Studio in the UK

Visual Studio
Salary Trend

3-month moving average salary quoted in jobs citing Visual Studio.

Salary trend for Visual Studio in the UK

Visual Studio
Salary Histogram

Salary distribution for jobs citing Visual Studio over the 6 months to 10 December 2023.

Salary histogram for Visual Studio in the UK

Visual Studio
Top 17 Job Locations

The table below looks at the demand and provides a guide to the median salaries quoted in IT jobs citing Visual Studio within the UK over the 6 months to 10 December 2023. The 'Rank Change' column provides an indication of the change in demand within each location based on the same 6 month period last year.

Location Rank Change
on Same Period
Last Year
Matching
Permanent
IT Job Ads
Median Salary
Past 6 Months
Median Salary
% Change
on Same Period
Last Year
Live
Jobs
England +4 316 £52,500 -4.55% 166
UK excluding London +3 252 £47,500 -5.00% 144
Work from Home -4 179 £55,000 -4.35% 86
London +119 86 £65,000 - 36
Midlands +86 63 £47,500 -5.00% 20
South East +12 61 £52,500 -4.55% 45
South West +57 58 £36,000 -28.00% 18
West Midlands +107 46 £47,500 -5.00% 12
North of England +59 25 £50,000 +5.26% 28
East of England +87 21 £45,000 -25.00% 14
North West +80 18 £47,000 -6.00% 17
East Midlands +22 17 £37,500 -25.00% 8
Scotland +12 12 £80,000 +52.38% 9
Wales +16 9 £50,000 +17.65% 9
Northern Ireland +38 7 £45,000 +12.50% 2
Yorkshire +49 6 £50,000 +5.26% 9
North East +33 1 £55,000 +15.79% 2

Visual Studio
Co-occurring Skills and Capabilities by Category

The follow tables expand on the table above by listing co-occurrences grouped by category. The same employment type, locality and period is covered with up to 20 co-occurrences shown in each of the following categories:

Application Platforms
1 45 (12.26%) Confluence
2 12 (3.27%) CMS
3 11 (3.00%) NServiceBus
4 10 (2.72%) IIS
4 10 (2.72%) SharePoint
5 4 (1.09%) WordPress
6 2 (0.54%) Sitecore CMS
6 2 (0.54%) Umbraco
7 1 (0.27%) WebSphere
Applications
1 29 (7.90%) Microsoft Office
2 11 (3.00%) Microsoft Excel
3 7 (1.91%) MS Visio
4 5 (1.36%) Microsoft Project
5 2 (0.54%) Microsoft PowerPoint
5 2 (0.54%) OrCAD
6 1 (0.27%) Adobe Illustrator
6 1 (0.27%) Photoshop
6 1 (0.27%) Simulink
Business Applications
1 20 (5.45%) Dynamics CRM
2 13 (3.54%) Payment Gateway
3 6 (1.63%) Shopify
4 4 (1.09%) Dynamics GP
4 4 (1.09%) Dynamics NAV
5 2 (0.54%) Elite 3E
5 2 (0.54%) Scribe Insight
5 2 (0.54%) SDL Web 8
6 1 (0.27%) Endur
6 1 (0.27%) Infor SunSystems
6 1 (0.27%) SAP ERP
6 1 (0.27%) Softmar
Cloud Services
1 146 (39.78%) Azure
2 68 (18.53%) Azure DevOps
3 44 (11.99%) Power Platform
4 23 (6.27%) PowerApps
5 20 (5.45%) SaaS
6 19 (5.18%) Azure Synapse Analytics
7 18 (4.90%) Dynamics 365
8 17 (4.63%) GitHub
9 12 (3.27%) Azure Data Factory
9 12 (3.27%) BrowserStack
9 12 (3.27%) Power Automate
10 11 (3.00%) Azure Service Bus
10 11 (3.00%) Microsoft 365
11 10 (2.72%) Azure Logic Apps
12 9 (2.45%) Serverless
13 7 (1.91%) AWS
14 6 (1.63%) Azure Functions
15 5 (1.36%) Azure Monitor
15 5 (1.36%) Azure Storage
15 5 (1.36%) Entra ID
Communications & Networking
1 20 (5.45%) WAN
2 17 (4.63%) 5G
2 17 (4.63%) SD-WAN
3 13 (3.54%) TCP/IP
4 6 (1.63%) Network Security
4 6 (1.63%) SNMP
5 4 (1.09%) Modbus
6 3 (0.82%) DNS
6 3 (0.82%) LAN
7 2 (0.54%) DHCP
7 2 (0.54%) Firewall
7 2 (0.54%) Link 16
7 2 (0.54%) Tactical Data Link
7 2 (0.54%) Wireshark
8 1 (0.27%) DMZ
8 1 (0.27%) Ethernet
8 1 (0.27%) Intranet
8 1 (0.27%) Kerberos
8 1 (0.27%) Unified Communications
Database & Business Intelligence
1 151 (41.14%) SQL Server
2 42 (11.44%) SQL Server Integration Services
3 29 (7.90%) Power BI
4 28 (7.63%) Relational Database
5 25 (6.81%) SQL Server Reporting Services
6 22 (5.99%) Data Warehouse
7 20 (5.45%) MySQL
7 20 (5.45%) NoSQL
8 17 (4.63%) Data Lake
9 10 (2.72%) Event Store
9 10 (2.72%) RavenDB
9 10 (2.72%) RDBMS
10 8 (2.18%) Elasticsearch
10 8 (2.18%) Oracle Database
11 7 (1.91%) Azure SQL Database
11 7 (1.91%) Redis
12 6 (1.63%) DB2
13 5 (1.36%) Crystal Reports
14 3 (0.82%) GIS
15 2 (0.54%) PostgreSQL
Development Applications
1 85 (23.16%) Git
2 65 (17.71%) JIRA
3 43 (11.72%) Bitbucket
4 34 (9.26%) Team Foundation Server
5 31 (8.45%) Selenium
6 28 (7.63%) Visual Studio Code
7 26 (7.08%) SpecFlow
8 25 (6.81%) SQL Server Management Studio (SSMS)
9 18 (4.90%) Postman
10 17 (4.63%) NUnit
11 10 (2.72%) Jenkins
11 10 (2.72%) Mercurial
12 8 (2.18%) git-flow
13 7 (1.91%) JetBrains Rider
13 7 (1.91%) MSBuild
13 7 (1.91%) Subversion
13 7 (1.91%) Tricentis qTest
14 5 (1.36%) SonarQube
15 4 (1.09%) Eclipse
15 4 (1.09%) GitLab
General
1 74 (20.16%) Social Skills
2 71 (19.35%) Finance
3 38 (10.35%) Games
3 38 (10.35%) Presentation Skills
4 36 (9.81%) Retail
5 24 (6.54%) Analytical Skills
6 22 (5.99%) Public Sector
7 21 (5.72%) Marketing
8 19 (5.18%) Aerospace
8 19 (5.18%) Law
9 13 (3.54%) Inclusion and Diversity
10 11 (3.00%) Legal
11 9 (2.45%) Organisational Skills
12 8 (2.18%) Telecoms
13 5 (1.36%) Banking
13 5 (1.36%) Electronics
14 4 (1.09%) Automotive
14 4 (1.09%) Documentation Skills
14 4 (1.09%) Manufacturing
15 3 (0.82%) Back Office
Job Titles
1 225 (61.31%) Developer
2 92 (25.07%) .NET Developer
3 57 (15.53%) Senior
4 54 (14.71%) C# Developer
5 51 (13.90%) Software Engineer
6 41 (11.17%) Full Stack Developer
7 38 (10.35%) C# .NET Developer
8 32 (8.72%) Games Developer
9 29 (7.90%) 3D Developer
9 29 (7.90%) Unity 3D Developer
10 27 (7.36%) Senior Developer
11 26 (7.08%) Senior Software Engineer
12 21 (5.72%) Full Stack .NET Developer
12 21 (5.72%) Full-Stack C# Developer
13 20 (5.45%) Software Developer
14 18 (4.90%) Lead
15 17 (4.63%) C++ Software Engineer
15 17 (4.63%) Linux Engineer
15 17 (4.63%) Web Developer
16 16 (4.36%) Azure Developer
Libraries, Frameworks & Software Standards
1 201 (54.77%) .NET
2 110 (29.97%) HTML
3 87 (23.71%) .NET Framework
4 79 (21.53%) ASP.NET
5 78 (21.25%) CSS
6 57 (15.53%) Web Services
7 49 (13.35%) HTML5
8 44 (11.99%) Entity Framework
9 42 (11.44%) React
10 41 (11.17%) ASP.NET Web API
11 39 (10.63%) jQuery
12 38 (10.35%) .NET Core
13 37 (10.08%) ASP.NET MVC
14 36 (9.81%) AngularJS
15 32 (8.72%) XML
16 30 (8.17%) Unity (Game Engine)
17 29 (7.90%) Twitter Bootstrap
18 28 (7.63%) Blazor
19 27 (7.36%) Vue
19 27 (7.36%) WinForms
Miscellaneous
1 30 (8.17%) Virtual Reality
2 18 (4.90%) Product Ownership
3 17 (4.63%) Mobile App
4 16 (4.36%) Greenfield Project
5 14 (3.81%) Enterprise Software
5 14 (3.81%) Self-Motivation
6 12 (3.27%) Data Structures
7 10 (2.72%) Virtual Team
8 9 (2.45%) GNSS
9 8 (2.18%) Legacy Systems
10 6 (1.63%) Management Information System
11 4 (1.09%) Derivative
12 3 (0.82%) Analogue Electronics
12 3 (0.82%) Foreign Exchange (FX)
12 3 (0.82%) Housing Association
12 3 (0.82%) Legacy Applications
12 3 (0.82%) Mobile Banking
13 2 (0.54%) Data Centre
13 2 (0.54%) IoT
13 2 (0.54%) Public Cloud
Operating Systems
1 43 (11.72%) Windows
2 28 (7.63%) Linux
3 8 (2.18%) Android
4 3 (0.82%) Apple iOS
4 3 (0.82%) Debian
5 2 (0.54%) Windows Server
6 1 (0.27%) FreeBSD
6 1 (0.27%) Mac OS
6 1 (0.27%) Mac OS X
6 1 (0.27%) Red Hat Enterprise Linux
6 1 (0.27%) Windows 10
6 1 (0.27%) Windows Server 2016
Processes & Methodologies
1 106 (28.88%) Agile
2 104 (28.34%) DevOps
3 97 (26.43%) Software Engineering
4 93 (25.34%) MVC
5 70 (19.07%) TDD
6 64 (17.44%) Design Patterns
7 62 (16.89%) Scrum
8 58 (15.80%) Test Automation
9 57 (15.53%) Full Stack Development
10 52 (14.17%) CRM
10 52 (14.17%) SDLC
11 46 (12.53%) OO
12 44 (11.99%) Web Development
13 40 (10.90%) Problem-Solving
13 40 (10.90%) UML
14 34 (9.26%) Business Intelligence
15 31 (8.45%) OOP
16 30 (8.17%) Mentoring
16 30 (8.17%) Use Case
17 29 (7.90%) Unit Testing
Programming Languages
1 248 (67.57%) C#
2 200 (54.50%) SQL
3 133 (36.24%) JavaScript
4 56 (15.26%) T-SQL
5 54 (14.71%) C++
6 28 (7.63%) PowerShell
6 28 (7.63%) Python
7 24 (6.54%) PHP
8 22 (5.99%) VB.NET
9 21 (5.72%) C
10 18 (4.90%) Bash
10 18 (4.90%) Perl
11 16 (4.36%) Java
12 14 (3.81%) TypeScript
13 8 (2.18%) Ada
13 8 (2.18%) Embedded C++
13 8 (2.18%) PL/SQL
14 7 (1.91%) Delphi
14 7 (1.91%) VBA
15 6 (1.63%) VBScript
Qualifications
1 94 (25.61%) Degree
2 44 (11.99%) Security Cleared
3 38 (10.35%) SC Cleared
4 31 (8.45%) BPSS Clearance
5 12 (3.27%) ISEB
5 12 (3.27%) ISTQB
6 9 (2.45%) Computer Science Degree
7 7 (1.91%) ISTQB Foundation Certification
8 4 (1.09%) Postgraduate
9 2 (0.54%) DBS Check
9 2 (0.54%) Master's Degree
10 1 (0.27%) HNC
10 1 (0.27%) MCP
10 1 (0.27%) Microsoft Certification
Quality Assurance & Compliance
1 31 (8.45%) QA
2 29 (7.90%) ISO/IEC 15288
3 20 (5.45%) PMO
4 8 (2.18%) Data Quality
4 8 (2.18%) SLA
5 7 (1.91%) MISRA
6 4 (1.09%) ISO 9001
7 2 (0.54%) ISO/IEC 27001
7 2 (0.54%) Software Quality Assurance
8 1 (0.27%) Accessibility
8 1 (0.27%) Def Stans
8 1 (0.27%) HL7
8 1 (0.27%) IEC 61508
8 1 (0.27%) IEC 62304
8 1 (0.27%) ISO 13485
8 1 (0.27%) TickIT
8 1 (0.27%) WCAG
System Software
1 14 (3.81%) Active Directory
2 6 (1.63%) Docker
3 5 (1.36%) VMware Infrastructure
4 1 (0.27%) Firmware
Systems Management
1 12 (3.27%) Kubernetes
2 5 (1.36%) HP ALM
3 4 (1.09%) SCCM
4 3 (0.82%) Active Directory Federation Services
4 3 (0.82%) Microsoft Intune
5 2 (0.54%) Ansible
5 2 (0.54%) Single Sign-On
5 2 (0.54%) Terraform
6 1 (0.27%) logstash
Vendors
1 160 (43.60%) Microsoft
2 20 (5.45%) Xamarin
3 12 (3.27%) Oracle
4 10 (2.72%) Atlassian
5 9 (2.45%) Aderant
6 6 (1.63%) SAP
7 5 (1.36%) HP
7 5 (1.36%) VMware
8 4 (1.09%) DocuSign
8 4 (1.09%) Intapp
8 4 (1.09%) OpenText
8 4 (1.09%) Parasoft
8 4 (1.09%) Siebel
9 3 (0.82%) iManage
9 3 (0.82%) Salesforce
10 2 (0.54%) Cadence
10 2 (0.54%) F5
10 2 (0.54%) Facebook
10 2 (0.54%) Sage
10 2 (0.54%) Sitecore