BMC Control-M
UK
The table below provides summary statistics for permanent job vacancies requiring Control-M skills. It includes a benchmarking guide to the annual salaries offered in vacancies that cited Control-M over the 6 months leading up to 28 May 2025, comparing them to the same period in the previous two years.
| 6 months to 28 May 2025 |
Same period 2024 | Same period 2023 | |
|---|---|---|---|
| Rank | 702 | 894 | 927 |
| Rank change year-on-year | +192 | +33 | +257 |
| Permanent jobs citing Control-M | 9 | 16 | 37 |
| As % of all permanent jobs advertised in the UK | 0.016% | 0.016% | 0.038% |
| As % of the Systems Management category | 0.16% | 0.16% | 0.26% |
| Number of salaries quoted | 4 | 14 | 20 |
| 10th Percentile | £44,000 | £49,500 | £40,000 |
| 25th Percentile | £46,250 | £60,313 | £53,750 |
| Median annual salary (50th Percentile) | £55,000 | £100,000 | £60,000 |
| Median % change year-on-year | -45.00% | +66.67% | -5.88% |
| 75th Percentile | £63,750 | £118,750 | £70,625 |
| 90th Percentile | £75,000 | £125,250 | £75,000 |
| UK excluding London median annual salary | £55,000 | - | £77,500 |
| % change year-on-year | - | - | +16.10% |
All Systems Management Skills
UK
Control-M falls under the Systems Management category. For comparison with the information above, the following table provides summary statistics for all permanent job vacancies requiring systems management skills.
| Permanent vacancies with a requirement for systems management skills | 5,552 | 9,834 | 14,355 |
| As % of all permanent jobs advertised in the UK | 10.15% | 9.63% | 14.66% |
| Number of salaries quoted | 3,064 | 7,033 | 8,941 |
| 10th Percentile | £35,000 | £32,500 | £35,400 |
| 25th Percentile | £47,500 | £45,000 | £48,091 |
| Median annual salary (50th Percentile) | £69,384 | £61,000 | £67,500 |
| Median % change year-on-year | +13.74% | -9.63% | -3.57% |
| 75th Percentile | £90,000 | £82,500 | £87,500 |
| 90th Percentile | £111,250 | £100,000 | £105,000 |
| UK excluding London median annual salary | £60,000 | £55,000 | £59,513 |
| % change year-on-year | +9.09% | -7.58% | +0.87% |
Control-M
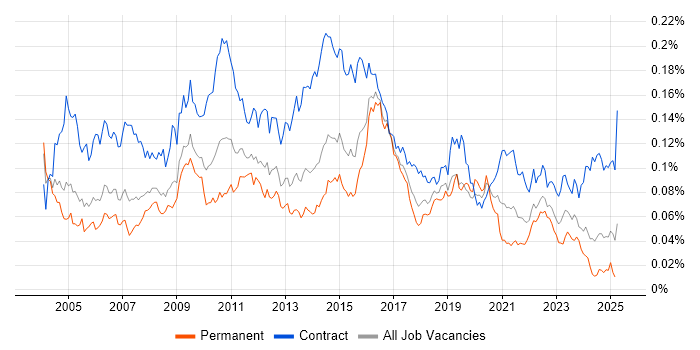
Job Vacancy Trend
Job postings citing Control-M as a proportion of all IT jobs advertised.

Control-M
Salary Trend
3-month moving average salary quoted in jobs citing Control-M.
Control-M
Salary Histogram
Salary distribution for jobs citing Control-M over the 6 months to 28 May 2025.
Control-M
Top 8 Job Locations
The table below looks at the demand and provides a guide to the median salaries quoted in IT jobs citing Control-M within the UK over the 6 months to 28 May 2025. The 'Rank Change' column provides an indication of the change in demand within each location based on the same 6 month period last year.
| Location | Rank Change on Same Period Last Year |
Matching Permanent IT Job Ads |
Median Salary Past 6 Months |
Median Salary % Change on Same Period Last Year |
Live Jobs |
|---|---|---|---|---|---|
| England | +149 | 6 | £65,000 | -35.00% | 2 |
| UK excluding London | - | 6 | £55,000 | - | 1 |
| London | +107 | 3 | - | - | 1 |
| North of England | - | 3 | £65,000 | - | 1 |
| Northern Ireland | - | 3 | £55,000 | - | |
| Work from Home | +122 | 2 | - | - | 4 |
| Yorkshire | - | 2 | - | - | |
| North East | - | 1 | £65,000 | - | 1 |
Control-M
Co-occurring Skills and Capabilities by Category
The follow tables expand on the table above by listing co-occurrences grouped by category. The same employment type, locality and period is covered with up to 20 co-occurrences shown in each of the following categories:
|
|
|||||||||||||||||||||||||||||||||||||||||||||||||||||||||||||||||||||||||||||||||||||||||||||
|
|
|||||||||||||||||||||||||||||||||||||||||||||||||||||||||||||||||||||||||||||||||||||||||||||
|
|
|||||||||||||||||||||||||||||||||||||||||||||||||||||||||||||||||||||||||||||||||||||||||||||
|
|
|||||||||||||||||||||||||||||||||||||||||||||||||||||||||||||||||||||||||||||||||||||||||||||
|
|
|||||||||||||||||||||||||||||||||||||||||||||||||||||||||||||||||||||||||||||||||||||||||||||
|
|
|||||||||||||||||||||||||||||||||||||||||||||||||||||||||||||||||||||||||||||||||||||||||||||
|
|
|||||||||||||||||||||||||||||||||||||||||||||||||||||||||||||||||||||||||||||||||||||||||||||
|
|
|||||||||||||||||||||||||||||||||||||||||||||||||||||||||||||||||||||||||||||||||||||||||||||
|
||||||||||||||||||||||||||||||||||||||||||||||||||||||||||||||||||||||||||||||||||||||||||||||
