Elastic Stack (formerly ELK Stack - Elasticsearch, Logstash & Kibana)
UK

The following table provides summary statistics for permanent job vacancies with a requirement for Elastic Stack skills. Included is a benchmarking guide to the salaries offered in vacancies that have cited Elastic Stack over the 6 months to 30 November 2023 with a comparison to the same period in the previous 2 years.

6 months to
30 Nov 2023
Same period 2022 Same period 2021
Rank 529 671 562
Rank change year-on-year +142 -109 -56
Permanent jobs citing Elastic Stack 202 460 655
As % of all permanent jobs advertised in the UK 0.38% 0.36% 0.51%
As % of the Libraries, Frameworks & Software Standards category 1.42% 1.12% 1.30%
Number of salaries quoted 132 206 308
10th Percentile £47,625 £50,000 £37,500
25th Percentile £56,250 £61,250 £51,250
Median annual salary (50th Percentile) £70,000 £80,000 £70,000
Median % change year-on-year -12.50% +14.29% +16.67%
75th Percentile £83,750 £94,688 £86,250
90th Percentile £90,000 £110,000 £99,125
UK excluding London median annual salary £62,500 £75,000 £57,500
% change year-on-year -16.67% +30.43% +9.52%

All Software Libraries and Frameworks
UK

Elastic Stack is in the Software Libraries and Frameworks category. The following table is for comparison with the above and provides summary statistics for all permanent job vacancies with a requirement for technical specification, industry standards, software libraries and framework skills.

Permanent vacancies with a requirement for technical specification, industry standards, software libraries and framework skills 14,242 41,228 50,192
As % of all permanent jobs advertised in the UK 26.45% 32.62% 38.77%
Number of salaries quoted 11,171 24,746 32,182
10th Percentile £41,250 £40,000 £36,250
25th Percentile £51,250 £50,000 £45,000
Median annual salary (50th Percentile) £67,250 £65,000 £60,000
Median % change year-on-year +3.46% +8.33% +4.35%
75th Percentile £85,000 £86,250 £80,000
90th Percentile £106,250 £105,000 £96,250
UK excluding London median annual salary £57,500 £57,500 £52,500
% change year-on-year - +9.52% +5.00%

Elastic Stack
Job Vacancy Trend

Job postings citing Elastic Stack as a proportion of all IT jobs advertised.
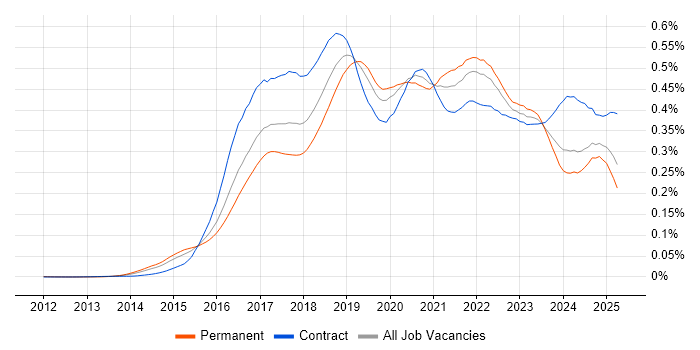
Job vacancy trend for Elastic Stack in the UK

Elastic Stack
Salary Trend

3-month moving average salary quoted in jobs citing Elastic Stack.

Salary trend for Elastic Stack in the UK

Elastic Stack
Salary Histogram

Salary distribution for jobs citing Elastic Stack over the 6 months to 30 November 2023.

Salary histogram for Elastic Stack in the UK

Elastic Stack
Top 15 Job Locations

The table below looks at the demand and provides a guide to the median salaries quoted in IT jobs citing Elastic Stack within the UK over the 6 months to 30 November 2023. The 'Rank Change' column provides an indication of the change in demand within each location based on the same 6 month period last year.

Location Rank Change
on Same Period
Last Year
Matching
Permanent
IT Job Ads
Median Salary
Past 6 Months
Median Salary
% Change
on Same Period
Last Year
Live
Jobs
England +153 181 £70,000 -15.15% 76
UK excluding London +173 133 £62,500 -16.67% 45
Work from Home +178 87 £70,000 -6.67% 50
London +170 67 £77,500 -8.82% 41
South East +152 43 £75,000 - 22
South West +78 33 £73,400 -13.65% 8
East of England +134 24 £60,000 -25.00% 1
North of England +118 23 £62,500 -19.35% 10
Yorkshire +96 14 £62,500 +13.64% 2
Midlands +114 10 £57,500 -25.81% 1
East Midlands +50 10 £57,500 -
North West +65 9 £70,000 -9.68% 4
Wales +16 6 £47,500 -5.00% 4
Scotland +32 5 £80,000 +27.58% 1
Northern Ireland - 1 - -

Elastic Stack
Co-occurring Skills and Capabilities by Category

The follow tables expand on the table above by listing co-occurrences grouped by category. The same employment type, locality and period is covered with up to 20 co-occurrences shown in each of the following categories:

Application Platforms
1 24 (11.88%) Apache
2 23 (11.39%) nginx
3 19 (9.41%) OpenStack
4 13 (6.44%) Apache Spark
5 12 (5.94%) Jupyter
6 11 (5.45%) IIS
7 10 (4.95%) MS Exchange
7 10 (4.95%) WebSphere
8 9 (4.46%) JBoss
8 9 (4.46%) Red Hat Fuse
9 7 (3.47%) SharePoint
10 5 (2.48%) Confluence
11 2 (0.99%) Apache Airflow
12 1 (0.50%) Apache TomEE
12 1 (0.50%) CMS
12 1 (0.50%) Tomcat
Applications
1 9 (4.46%) AutoCAD
1 9 (4.46%) PTC Creo
1 9 (4.46%) SOLIDWORKS
Business Applications
1 2 (0.99%) Salerio
Cloud Services
1 121 (59.90%) AWS
2 115 (56.93%) Azure
3 47 (23.27%) Amazon EKS
4 46 (22.77%) Serverless
5 42 (20.79%) Azure DevOps
6 32 (15.84%) AWS CloudFormation
7 29 (14.36%) GCP
8 28 (13.86%) Amazon EC2
8 28 (13.86%) Amazon S3
9 25 (12.38%) OpenShift
9 25 (12.38%) Route 53
10 20 (9.90%) Entra ID
11 17 (8.42%) Amazon ECS
12 16 (7.92%) AWS Lambda
12 16 (7.92%) GitHub
12 16 (7.92%) MinIO
12 16 (7.92%) PaaS
13 15 (7.43%) Amazon CloudWatch
13 15 (7.43%) Virtual Private Cloud
14 12 (5.94%) IaaS
Communications & Networking
1 18 (8.91%) DNS
2 14 (6.93%) Firewall
3 9 (4.46%) TCP/IP
4 8 (3.96%) HTTP
4 8 (3.96%) Internet
5 7 (3.47%) WAN
6 6 (2.97%) BGP
6 6 (2.97%) VLAN
7 5 (2.48%) IPv4
7 5 (2.48%) VPN
8 4 (1.98%) 5G
8 4 (1.98%) IPv6
8 4 (1.98%) OSPF
8 4 (1.98%) SD-WAN
8 4 (1.98%) SMTP
9 3 (1.49%) LAN
9 3 (1.49%) SNMP
9 3 (1.49%) SSL
10 2 (0.99%) MPLS
10 2 (0.99%) RSVP
Database & Business Intelligence
1 32 (15.84%) SQL Server
2 28 (13.86%) PostgreSQL
3 25 (12.38%) Elasticsearch
4 18 (8.91%) Big Data
5 17 (8.42%) Amazon RDS
5 17 (8.42%) Hadoop
6 16 (7.92%) Relational Database
7 13 (6.44%) MongoDB
8 12 (5.94%) InfluxDB
8 12 (5.94%) Presto
9 11 (5.45%) NoSQL
10 10 (4.95%) SAP HANA
11 9 (4.46%) MySQL
12 5 (2.48%) Apache Cassandra
13 4 (1.98%) ArangoDB
14 3 (1.49%) Azure SQL Data Warehouse
14 3 (1.49%) Data Warehouse
15 2 (0.99%) Amazon Aurora
15 2 (0.99%) RDBMS
15 2 (0.99%) SQL Server Reporting Services
Development Applications
1 136 (67.33%) Jenkins
2 79 (39.11%) GitLab
3 68 (33.66%) Git
4 35 (17.33%) SonarQube
5 34 (16.83%) Artifactory
6 29 (14.36%) Maven
7 27 (13.37%) JIRA
8 22 (10.89%) CircleCI
9 20 (9.90%) Atlassian Bamboo
10 16 (7.92%) Bitbucket
11 12 (5.94%) Sonatype Nexus
12 11 (5.45%) JUnit
13 10 (4.95%) Chocolatey
14 8 (3.96%) Cucumber
15 6 (2.97%) git-flow
16 5 (2.48%) Octopus Deploy
16 5 (2.48%) Travis CI
17 4 (1.98%) Gradle
18 2 (0.99%) Selenium
18 2 (0.99%) SQL Server Management Studio (SSMS)
General
1 39 (19.31%) Public Sector
2 20 (9.90%) Finance
3 17 (8.42%) Social Skills
4 12 (5.94%) Banking
5 7 (3.47%) Aerospace
6 6 (2.97%) Analytical Skills
6 6 (2.97%) Financial Institution
6 6 (2.97%) Retail
7 4 (1.98%) Presentation Skills
7 4 (1.98%) Telecoms
8 2 (0.99%) Cantonese Language
8 2 (0.99%) Mandarin Language
9 1 (0.50%) Automotive
9 1 (0.50%) Back Office
9 1 (0.50%) Billing
9 1 (0.50%) Documentation Skills
9 1 (0.50%) Inclusion and Diversity
9 1 (0.50%) Law
9 1 (0.50%) Marketing
9 1 (0.50%) Publishing
Job Titles
1 116 (57.43%) DevOps Engineer
2 33 (16.34%) Azure Engineer
3 30 (14.85%) Senior
4 28 (13.86%) AWS Engineer
4 28 (13.86%) Azure DevOps Engineer
5 26 (12.87%) AWS DevOps
6 24 (11.88%) Developer
7 23 (11.39%) AWS DevOps Engineer
8 20 (9.90%) Infrastructure Engineer
9 16 (7.92%) Cloud Engineer
9 16 (7.92%) Java Developer
10 14 (6.93%) Senior DevOps
10 14 (6.93%) Senior DevOps Engineer
10 14 (6.93%) Site Reliability Engineer
11 13 (6.44%) Data Engineer
12 12 (5.94%) Big Data Engineer
12 12 (5.94%) Site Engineer
13 11 (5.45%) Automation Engineer
14 10 (4.95%) Platform Engineer
15 8 (3.96%) Linux Engineer
Libraries, Frameworks & Software Standards
1 39 (19.31%) RabbitMQ
2 30 (14.85%) REST
3 23 (11.39%) YAML
4 22 (10.89%) Web Services
5 18 (8.91%) Node.js
6 17 (8.42%) Kafka
6 17 (8.42%) RESTful
6 17 (8.42%) XML
7 15 (7.43%) AngularJS
7 15 (7.43%) JSON
7 15 (7.43%) Spring
7 15 (7.43%) Spring Boot
8 14 (6.93%) Apache Camel
9 13 (6.44%) LDAP
10 12 (5.94%) ActiveMQ
10 12 (5.94%) Apache NiFi
11 10 (4.95%) SOAP
12 9 (4.46%) J2EE
13 4 (1.98%) FIX Protocol
13 4 (1.98%) React
Miscellaneous
1 40 (19.80%) Distributed Systems
2 26 (12.87%) Public Cloud
3 14 (6.93%) Private Cloud
3 14 (6.93%) Self-Motivation
4 12 (5.94%) Data Centre
4 12 (5.94%) Hybrid Cloud
5 10 (4.95%) Enterprise Software
6 9 (4.46%) Operational Technology
7 8 (3.96%) Onboarding
8 7 (3.47%) Product Ownership
9 6 (2.97%) CMDB
10 5 (2.48%) Enterprise Storage
10 5 (2.48%) Management Information System
10 5 (2.48%) Virtual Team
11 4 (1.98%) Distributed Applications
11 4 (1.98%) GNSS
11 4 (1.98%) Tandem
12 3 (1.49%) Greenfield Project
13 2 (0.99%) Cloud Native
13 2 (0.99%) Cyber Kill Chain
Operating Systems
1 131 (64.85%) Linux
2 61 (30.20%) Windows
3 22 (10.89%) Debian
4 19 (9.41%) Windows Server
5 18 (8.91%) Ubuntu
6 17 (8.42%) Unix
7 13 (6.44%) Red Hat Enterprise Linux
8 11 (5.45%) Windows Server 2012
9 5 (2.48%) Windows 10
9 5 (2.48%) Windows Server 2016
10 4 (1.98%) CentOS
11 1 (0.50%) Mac OS X
11 1 (0.50%) Rocky
11 1 (0.50%) Windows Server 2008
Processes & Methodologies
1 156 (77.23%) DevOps
2 124 (61.39%) CI/CD
3 99 (49.01%) Infrastructure as Code
4 83 (41.09%) Containerisation
5 77 (38.12%) Agile
6 63 (31.19%) Microservices
7 50 (24.75%) Configuration Management
8 45 (22.28%) Continuous Integration
9 44 (21.78%) Scrum
10 43 (21.29%) Kanban
11 36 (17.82%) Software Engineering
12 35 (17.33%) Deployment Automation
13 28 (13.86%) Site Reliability Engineering
14 24 (11.88%) Infrastructure Engineering
14 24 (11.88%) Problem-Solving
15 23 (11.39%) Analytics
16 20 (9.90%) Auto-Scaling
16 20 (9.90%) Continuous Delivery
17 19 (9.41%) Service Delivery
17 19 (9.41%) Test Automation
Programming Languages
1 101 (50.00%) Python
2 85 (42.08%) Bash
3 63 (31.19%) Java
4 57 (28.22%) PowerShell
5 35 (17.33%) Shell Script
6 29 (14.36%) Perl
7 27 (13.37%) SQL
8 18 (8.91%) JavaScript
9 14 (6.93%) Groovy
10 9 (4.46%) Go
10 9 (4.46%) MATLAB
11 6 (2.97%) Kotlin
11 6 (2.97%) Ruby
12 5 (2.48%) Bicep
13 3 (1.49%) R
14 1 (0.50%) Clojure
14 1 (0.50%) Kusto Query Language
14 1 (0.50%) Rust
14 1 (0.50%) Scala
14 1 (0.50%) TypeScript
Qualifications
1 66 (32.67%) Security Cleared
2 47 (23.27%) SC Cleared
3 15 (7.43%) AWS Certification
3 15 (7.43%) Degree
3 15 (7.43%) Microsoft Certification
4 14 (6.93%) DV Cleared
5 13 (6.44%) AWS Certified Solutions Architect
6 10 (4.95%) MCSA
6 10 (4.95%) MCSE
7 8 (3.96%) Azure Certification
8 7 (3.47%) Computer Science Degree
9 6 (2.97%) BPSS Clearance
10 5 (2.48%) Cisco Certification
10 5 (2.48%) ITIL Certification
11 3 (1.49%) CCNP
12 2 (0.99%) CCNA
12 2 (0.99%) VMware Certified Professional (VCP)
13 1 (0.50%) AWS Certified DevOps Engineer
13 1 (0.50%) AWS Certified SysOps Administrator
13 1 (0.50%) Master's Degree
Quality Assurance & Compliance
1 23 (11.39%) QA
2 7 (3.47%) SLA
3 1 (0.50%) Accessibility
3 1 (0.50%) Cyber Essentials
3 1 (0.50%) GDPR
3 1 (0.50%) ISO/IEC 27001
System Software
1 135 (66.83%) Docker
2 46 (22.77%) Active Directory
3 25 (12.38%) VMware Infrastructure
4 5 (2.48%) Hyper-V
4 5 (2.48%) Varnish
5 4 (1.98%) Ceph
6 3 (1.49%) VMware ESXi
7 1 (0.50%) NFS
7 1 (0.50%) Virtual Machines
7 1 (0.50%) VirtualBox
Systems Management
1 154 (76.24%) Kubernetes
2 143 (70.79%) Ansible
3 132 (65.35%) Terraform
4 89 (44.06%) Grafana
5 77 (38.12%) Prometheus
6 35 (17.33%) Puppet
7 25 (12.38%) Packer
8 14 (6.93%) HAProxy
9 12 (5.94%) Kustomize
10 11 (5.45%) Active Directory Federation Services
11 10 (4.95%) Kibana
11 10 (4.95%) Nagios
11 10 (4.95%) Progress Chef
11 10 (4.95%) SCCM
11 10 (4.95%) SCOM
12 7 (3.47%) ZABBIX
13 5 (2.48%) logstash
13 5 (2.48%) Rancher
14 3 (1.49%) Check_MK
14 3 (1.49%) Graphite
Vendors
1 40 (19.80%) Microsoft
2 38 (18.81%) VMware
3 32 (15.84%) Splunk
4 23 (11.39%) AppDynamics
5 20 (9.90%) IBM
6 18 (8.91%) Oracle
7 14 (6.93%) WSO2
8 13 (6.44%) Atlassian
9 10 (4.95%) Google
9 10 (4.95%) SAP
9 10 (4.95%) TOWER Software
10 9 (4.46%) Cisco
10 9 (4.46%) MathWorks
10 9 (4.46%) PTC
10 9 (4.46%) Red Hat
11 6 (2.97%) ServiceNow
12 5 (2.48%) EMC
12 5 (2.48%) McAfee
13 4 (1.98%) Rackspace
14 2 (0.99%) New Relic