Investment Banking
UK

The table below looks at the prevalence of the term Investment Banking in permanent job vacancies. Included is a benchmarking guide to the salaries offered in vacancies that have cited Investment Banking over the 6 months to 7 December 2023 with a comparison to the same period over the previous 2 years.

6 months to
7 Dec 2023
Same period 2022 Same period 2021
Rank 309 487 516
Rank change year-on-year +178 +29 -114
Permanent jobs citing Investment Banking 537 766 716
As % of all permanent jobs advertised in the UK 1.01% 0.62% 0.56%
As % of the General category 1.54% 0.91% 0.93%
Number of salaries quoted 312 593 591
10th Percentile £55,000 £54,000 £48,750
25th Percentile £71,250 £67,500 £64,375
Median annual salary (50th Percentile) £107,500 £90,000 £82,500
Median % change year-on-year +19.44% +9.09% -8.33%
75th Percentile £140,625 £120,000 £103,125
90th Percentile £150,000 £140,000 £120,000
UK excluding London median annual salary £64,250 £65,000 £50,500
% change year-on-year -1.15% +28.71% -12.17%

All General Skills
UK

Investment Banking is in the General Skills category. The following table is for comparison with the above and provides summary statistics for all permanent job vacancies with a requirement for common skills.

Permanent vacancies with a requirement for common skills 34,825 84,481 76,781
As % of all permanent jobs advertised in the UK 65.73% 68.77% 59.91%
Number of salaries quoted 24,374 48,187 48,005
10th Percentile £30,500 £32,500 £31,500
25th Percentile £42,500 £45,000 £42,250
Median annual salary (50th Percentile) £60,000 £60,000 £57,500
Median % change year-on-year - +4.35% +4.55%
75th Percentile £80,000 £82,500 £78,750
90th Percentile £100,000 £100,000 £97,500
UK excluding London median annual salary £50,000 £52,500 £49,250
% change year-on-year -4.76% +6.60% +3.68%

Investment Banking
Job Vacancy Trend

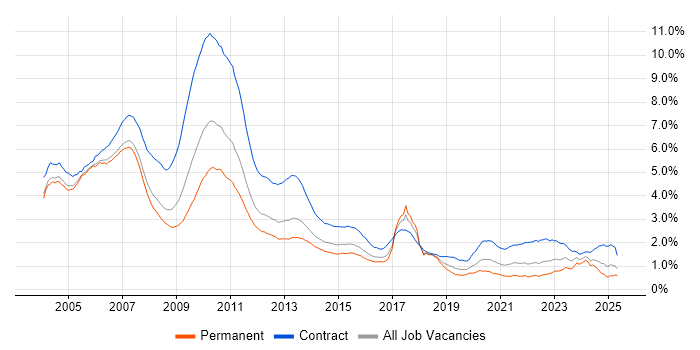
Job postings citing Investment Banking as a proportion of all IT jobs advertised.

Job vacancy trend for Investment Banking in the UK

Investment Banking
Salary Trend

3-month moving average salary quoted in jobs citing Investment Banking.

Salary trend for Investment Banking in the UK

Investment Banking
Salary Histogram

Salary distribution for jobs citing Investment Banking over the 6 months to 7 December 2023.

Salary histogram for Investment Banking in the UK

Investment Banking
Top 11 Job Locations

The table below looks at the demand and provides a guide to the median salaries quoted in IT jobs citing Investment Banking within the UK over the 6 months to 7 December 2023. The 'Rank Change' column provides an indication of the change in demand within each location based on the same 6 month period last year.

Location Rank Change
on Same Period
Last Year
Matching
Permanent
IT Job Ads
Median Salary
Past 6 Months
Median Salary
% Change
on Same Period
Last Year
Live
Jobs
England +173 511 £107,500 +19.25% 212
London +151 498 £110,000 +15.79% 182
Work from Home +174 155 £110,000 +22.22% 89
UK excluding London +183 38 £64,250 -1.15% 48
Scotland +31 22 £66,000 -5.71% 6
South East +128 6 £43,750 -20.45% 17
North of England +123 4 £71,500 +10.00% 13
North West +99 4 £71,500 +10.00% 8
Northern Ireland +36 3 - - 3
East of England - 2 £77,500 - 2
South West +68 1 - - 8

Investment Banking
Co-occurring Skills and Capabilities by Category

The follow tables expand on the table above by listing co-occurrences grouped by category. The same employment type, locality and period is covered with up to 20 co-occurrences shown in each of the following categories:

Application Platforms
1 55 (10.24%) Apache
2 52 (9.68%) Apache Airflow
3 13 (2.42%) SharePoint
4 5 (0.93%) Apache Spark
4 5 (0.93%) Confluence
4 5 (0.93%) IIS
5 4 (0.74%) MS Exchange
6 2 (0.37%) Camunda
6 2 (0.37%) Jupyter
6 2 (0.37%) WebSphere
7 1 (0.19%) Apache Solr
Applications
1 148 (27.56%) Microsoft Excel
2 143 (26.63%) Microsoft PowerPoint
3 125 (23.28%) Microsoft Office
4 1 (0.19%) MS Visio
4 1 (0.19%) Spreadsheet
Business Applications
1 13 (2.42%) Adaptiv
2 4 (0.74%) Fidessa
3 2 (0.37%) Dynamics CRM
4 1 (0.19%) Oracle FAH
4 1 (0.19%) Oracle General Ledger
4 1 (0.19%) Oracle Subledger Accounting
Cloud Services
1 163 (30.35%) AWS
2 123 (22.91%) GCP
3 72 (13.41%) Azure
4 54 (10.06%) dbt
4 54 (10.06%) GitHub
5 41 (7.64%) OpenShift
6 35 (6.52%) GitHub Actions
7 26 (4.84%) Microsoft 365
8 18 (3.35%) AWS CloudFormation
9 10 (1.86%) Power Platform
10 8 (1.49%) PaaS
11 7 (1.30%) Azure Data Factory
11 7 (1.30%) SaaS
12 4 (0.74%) Entra ID
12 4 (0.74%) Snowflake
12 4 (0.74%) WhatsApp
13 3 (0.56%) Azure DevOps
13 3 (0.56%) Cloud Computing
13 3 (0.56%) IaaS
14 2 (0.37%) PowerApps
Communications & Networking
1 9 (1.68%) Internet
2 8 (1.49%) DHCP
2 8 (1.49%) DNS
3 7 (1.30%) SAN
4 4 (0.74%) 3G
4 4 (0.74%) DSL
4 4 (0.74%) HTTP
4 4 (0.74%) IPv4
4 4 (0.74%) TCP/IP
4 4 (0.74%) VPN
4 4 (0.74%) Wi-Fi
5 3 (0.56%) Firewall
5 3 (0.56%) LAN
5 3 (0.56%) WAN
6 1 (0.19%) Cisco IOS
6 1 (0.19%) IP Telephony
6 1 (0.19%) MPLS
6 1 (0.19%) SD-WAN
6 1 (0.19%) Wireless
Database & Business Intelligence
1 54 (10.06%) Apache Arrow
1 54 (10.06%) Dremio
2 52 (9.68%) Amazon Athena
2 52 (9.68%) Apache Ignite
3 11 (2.05%) SQL Server
4 9 (1.68%) Data Warehouse
4 9 (1.68%) Tableau
5 8 (1.49%) Big Data
5 8 (1.49%) Oracle Reports
5 8 (1.49%) Power BI
6 6 (1.12%) Data Lake
6 6 (1.12%) PostgreSQL
7 4 (0.74%) DB2
7 4 (0.74%) KDB
7 4 (0.74%) MongoDB
7 4 (0.74%) NoSQL
8 2 (0.37%) Azure SQL Database
8 2 (0.37%) Kdb+
8 2 (0.37%) Oracle Database
8 2 (0.37%) Relational Database
Development Applications
1 32 (5.96%) GitLab
2 27 (5.03%) Jenkins
3 22 (4.10%) Git
4 10 (1.86%) JIRA
5 8 (1.49%) Maven
6 6 (1.12%) TeamCity
7 5 (0.93%) FitNesse
7 5 (0.93%) Octopus Deploy
7 5 (0.93%) Selenium
7 5 (0.93%) SonarQube
7 5 (0.93%) WebDriver
8 2 (0.37%) JUnit
9 1 (0.19%) webpack
General
1 537 (100.00%) Banking
2 448 (83.43%) Finance
3 145 (27.00%) Front Office
4 130 (24.21%) Social Skills
5 57 (10.61%) Analytical Skills
6 33 (6.15%) Financial Institution
6 33 (6.15%) French Language
7 28 (5.21%) Legal
8 21 (3.91%) Inclusion and Diversity
8 21 (3.91%) Law
9 17 (3.17%) Telecoms
10 13 (2.42%) Marketing
11 7 (1.30%) Back Office
11 7 (1.30%) Presentation Skills
11 7 (1.30%) Retail
12 4 (0.74%) Corporate Banking
12 4 (0.74%) Private Banking
12 4 (0.74%) Retail Banking
13 2 (0.37%) Advertising
13 2 (0.37%) Public Sector
Job Titles
1 223 (41.53%) Analyst
2 149 (27.75%) Developer
3 121 (22.53%) Business Strategy Analyst
3 121 (22.53%) Strategy Analyst
4 94 (17.50%) AWS Engineer
5 73 (13.59%) Java Developer
6 67 (12.48%) Software Engineer
7 56 (10.43%) AWS Software Engineer
8 52 (9.68%) AWS Developer
8 52 (9.68%) Developer/Software Engineer
9 40 (7.45%) Python Engineer
10 39 (7.26%) AWS DevOps
11 38 (7.08%) AWS DevOps Engineer
11 38 (7.08%) DevOps Engineer
12 34 (6.33%) Lead
13 30 (5.59%) Java Engineer
14 29 (5.40%) Python Developer
15 28 (5.21%) Java Software Engineer
15 28 (5.21%) Senior
16 25 (4.66%) Electronic Trading Developer
Libraries, Frameworks & Software Standards
1 55 (10.24%) NumPy
1 55 (10.24%) Pandas
2 52 (9.68%) gRPC
2 52 (9.68%) Protocol Buffers
2 52 (9.68%) SciPy
3 20 (3.72%) .NET
3 20 (3.72%) AngularJS
4 19 (3.54%) FIX Protocol
4 19 (3.54%) Spring
5 17 (3.17%) Spring Boot
6 10 (1.86%) Kafka
6 10 (1.86%) Web Services
7 9 (1.68%) REST
8 8 (1.49%) HTML
9 7 (1.30%) .NET Framework
9 7 (1.30%) ASP.NET
9 7 (1.30%) ASP.NET Web API
9 7 (1.30%) JPA
9 7 (1.30%) LINQ
10 6 (1.12%) XML
Miscellaneous
1 124 (23.09%) Self-Motivation
2 34 (6.33%) Equities
3 22 (4.10%) Fixed Income
4 21 (3.91%) Hedge funds
5 20 (3.72%) Credit Risk
5 20 (3.72%) Foreign Exchange (FX)
6 18 (3.35%) Derivative
7 17 (3.17%) Public Cloud
7 17 (3.17%) Renewable Energy
8 16 (2.98%) Management Information System
9 12 (2.23%) Algorithms
10 10 (1.86%) Greenfield Project
10 10 (1.86%) Product Ownership
11 9 (1.68%) Cloud Native
11 9 (1.68%) Market Risk
12 8 (1.49%) Robotics
13 7 (1.30%) Data Structures
14 6 (1.12%) Distributed Systems
14 6 (1.12%) Private Cloud
14 6 (1.12%) Reference Data
Operating Systems
1 31 (5.77%) Linux
2 30 (5.59%) Windows
3 21 (3.91%) Windows Server
4 20 (3.72%) Unix
5 19 (3.54%) Red Hat Enterprise Linux
6 9 (1.68%) Windows 10
7 5 (0.93%) Data ONTAP
8 4 (0.74%) Android
8 4 (0.74%) Apple iOS
9 2 (0.37%) Solaris
9 2 (0.37%) VMS
9 2 (0.37%) Windows 7
9 2 (0.37%) Windows Server 2008
9 2 (0.37%) Windows Server 2012
10 1 (0.19%) CentOS
10 1 (0.19%) Ubuntu
Processes & Methodologies
1 245 (45.62%) Asset Management
2 172 (32.03%) Agile
3 124 (23.09%) Business Strategy
4 121 (22.53%) Benchmarking
4 121 (22.53%) Business Forecasting
4 121 (22.53%) Competitor Analysis
4 121 (22.53%) Creative Thinking
4 121 (22.53%) Planning and Forecasting
5 103 (19.18%) Software Engineering
6 83 (15.46%) DevOps
7 81 (15.08%) CI/CD
8 66 (12.29%) Analytics
9 50 (9.31%) Data Architecture
10 46 (8.57%) Migration
11 44 (8.19%) Test Automation
12 42 (7.82%) Electronic Trading
12 42 (7.82%) Financial Modelling
12 42 (7.82%) Problem-Solving
13 39 (7.26%) Platform Engineering
13 39 (7.26%) Release Automation
Programming Languages
1 180 (33.52%) Java
2 155 (28.86%) Python
3 77 (14.34%) SQL
4 71 (13.22%) JavaScript
5 59 (10.99%) TypeScript
6 42 (7.82%) Go
7 32 (5.96%) Ruby
8 23 (4.28%) Scala
9 21 (3.91%) C#
10 19 (3.54%) PowerShell
11 18 (3.35%) Perl
12 16 (2.98%) Bash
13 14 (2.61%) Korn
14 7 (1.30%) PL/SQL
15 6 (1.12%) C++
16 5 (0.93%) XAML
17 4 (0.74%) Kotlin
18 1 (0.19%) Clojure
18 1 (0.19%) XPath
Qualifications
1 86 (16.01%) Degree
2 24 (4.47%) Master's Degree
3 17 (3.17%) CFA
4 14 (2.61%) Computer Science Degree
5 4 (0.74%) MCSA
5 4 (0.74%) Microsoft Certification
6 2 (0.37%) Azure Certification
6 2 (0.37%) PMP
7 1 (0.19%) PMI Certification
Quality Assurance & Compliance
1 17 (3.17%) SLA
2 12 (2.23%) Accessibility
3 11 (2.05%) QA
4 3 (0.56%) PMO
5 1 (0.19%) COREP
5 1 (0.19%) IFRS
5 1 (0.19%) IFRS 17
5 1 (0.19%) IFRS 9
5 1 (0.19%) Sarbanes-Oxley
5 1 (0.19%) SEPA
System Software
1 48 (8.94%) Docker
2 33 (6.15%) Active Directory
3 2 (0.37%) DFS Replication
3 2 (0.37%) Virtual Machines
3 2 (0.37%) VMware ESXi
3 2 (0.37%) VMware NSX
3 2 (0.37%) vSphere
4 1 (0.19%) Apache Flume
4 1 (0.19%) GFS2
4 1 (0.19%) GPFS
4 1 (0.19%) HDFS
4 1 (0.19%) Microsoft App-V
4 1 (0.19%) Slurm Workload Manager
4 1 (0.19%) VMware Infrastructure
Systems Management
1 59 (10.99%) Kubernetes
2 42 (7.82%) Terraform
3 38 (7.08%) Rancher
4 33 (6.15%) Argo
5 18 (3.35%) Control-M
6 17 (3.17%) Ansible
7 15 (2.79%) Puppet
8 14 (2.61%) Oracle Enterprise Manager
8 14 (2.61%) Red Hat Satellite
9 13 (2.42%) SafeCom
10 8 (1.49%) SCCM
11 7 (1.30%) NetBackup
12 6 (1.12%) Active Directory Federation Services
13 4 (0.74%) Single Sign-On
14 2 (0.37%) BMC PATROL
14 2 (0.37%) EMC NetWorker
14 2 (0.37%) Microsoft Intune
14 2 (0.37%) SCOM
15 1 (0.19%) Oozie
15 1 (0.19%) Progress Chef
Vendors
1 154 (28.68%) Microsoft
2 29 (5.40%) Oracle
3 25 (4.66%) Bloomberg
4 21 (3.91%) Red Hat
5 18 (3.35%) Veritas
6 15 (2.79%) TOWER Software
7 14 (2.61%) Sun
8 13 (2.42%) SolarWinds
9 5 (0.93%) Citrix
9 5 (0.93%) NetApp
9 5 (0.93%) Sybase
10 4 (0.74%) Alteryx
10 4 (0.74%) Cisco
10 4 (0.74%) Cognos
10 4 (0.74%) Databricks
10 4 (0.74%) Reuters
11 3 (0.56%) VMware
12 2 (0.37%) Cadence
12 2 (0.37%) HP
12 2 (0.37%) SAP