Analytical Mindset Job Trends

Analytical Mindset
UK

The table below looks at the prevalence of the term Analytical Mindset in permanent job vacancies. Included is a benchmarking guide to the salaries offered in vacancies that cited Analytical Mindset over the 6 months leading up to 17 November 2025, comparing them to the same period in the previous two years.

6 months to
17 Nov 2025
Same period 2024 Same period 2023
Rank 224 452 494
Rank change year-on-year +228 +42 +125
Permanent jobs citing Analytical Mindset 602 330 240
As % of all permanent jobs in the UK 1.15% 0.49% 0.45%
As % of the Miscellaneous category 3.12% 1.49% 1.18%
Number of salaries quoted 346 160 179
10th Percentile £29,000 £39,425 £26,000
25th Percentile £35,688 £44,165 £32,500
Median annual salary (50th Percentile) £50,000 £60,000 £50,000
Median % change year-on-year -16.67% +20.00% +5.26%
75th Percentile £67,744 £72,500 £67,500
90th Percentile £87,500 £97,750 £85,000
UK excluding London median annual salary £45,000 £57,500 £47,500
% change year-on-year -21.74% +21.05% +5.56%

All Generic Skills
UK

Analytical Mindset falls under the General and Transferable Skills category. For comparison with the information above, the following table provides summary statistics for all permanent job vacancies requiring generic IT skills.

Permanent vacancies with a requirement for generic IT skills 19,279 22,122 20,390
As % of all permanent jobs advertised in the UK 36.81% 32.87% 38.60%
Number of salaries quoted 10,635 10,653 15,227
10th Percentile £27,750 £33,750 £34,000
25th Percentile £36,000 £45,700 £45,321
Median annual salary (50th Percentile) £53,500 £60,000 £62,500
Median % change year-on-year -10.83% -4.00% -
75th Percentile £77,500 £83,750 £84,056
90th Percentile £100,000 £110,000 £107,500
UK excluding London median annual salary £45,000 £54,000 £55,000
% change year-on-year -16.67% -1.82% -

Analytical Mindset
Job Vacancy Trend

Historical trend showing the proportion of permanent IT job postings citing Analytical Mindset relative to all permanent IT jobs advertised.
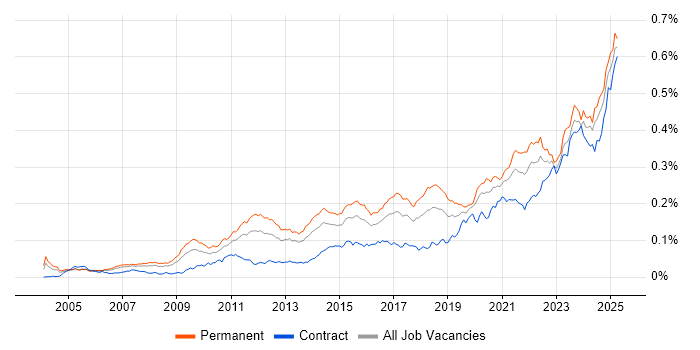
Analytical Mindset job vacancy trend in the UK

Analytical Mindset
Salary Trend

Salary distribution trend for jobs in the UK citing Analytical Mindset.

Salary distribution trend for jobs in the UK citing Analytical Mindset

Analytical Mindset
Salary Histogram

Salary distribution for jobs citing Analytical Mindset over the 6 months to 17 November 2025.

Salary histogram for Analytical Mindset in the UK

Analytical Mindset
Top 17 Job Locations

The table below looks at the demand and provides a guide to the median salaries quoted in IT jobs citing Analytical Mindset within the UK over the 6 months to 17 November 2025. The 'Rank Change' column provides an indication of the change in demand within each location based on the same 6 month period last year.

Location Rank Change
on Same Period
Last Year
Matching
Permanent
IT Job Ads
Median Salary
Past 6 Months
Median Salary
% Change
on Same Period
Last Year
Live
Jobs
England +233 538 £50,000 -16.67% 487
UK excluding London +220 418 £45,000 -21.74% 245
Work from Home +151 214 £50,000 -9.09% 262
London +122 159 £61,250 -9.26% 286
South East +109 135 £45,000 -12.62% 94
Midlands +108 75 £53,459 +15.74% 36
South West +70 74 £50,000 -33.33% 16
North of England +61 72 £42,500 -22.73% 50
North West +69 56 £42,500 -22.73% 39
East Midlands +50 47 £80,000 +42.22% 18
West Midlands +65 28 £47,980 +3.88% 18
Scotland -4 24 £26,150 -59.77% 10
East of England +32 19 £62,500 +16.28% 25
Northern Ireland - 14 - - 12
Yorkshire +6 11 £47,500 -24.00% 9
Wales +13 5 £47,500 -3.27% 7
North East - 5 - - 2

Analytical Mindset
Co-Occurring Skills & Capabilities by Category

The following tables expand on the one above by listing co-occurrences grouped by category. They cover the same employment type, locality and period, with up to 20 co-occurrences shown in each category:

Application Platforms
1 18 (2.99%) Confluence
2 17 (2.82%) SharePoint
3 8 (1.33%) CMS
4 7 (1.16%) Microsoft Exchange
5 4 (0.66%) IIS
5 4 (0.66%) SAS
6 3 (0.50%) WordPress
7 2 (0.33%) Skype for Business
8 1 (0.17%) Apache Spark
8 1 (0.17%) BizTalk Server
8 1 (0.17%) Drupal
8 1 (0.17%) Oracle Workflow
Applications
1 119 (19.77%) Microsoft Excel
2 29 (4.82%) Microsoft Office
3 25 (4.15%) Microsoft PowerPoint
4 13 (2.16%) Microsoft Project
5 12 (1.99%) Maya
6 9 (1.50%) MS Visio
7 4 (0.66%) PlantUML
8 3 (0.50%) Spreadsheet
8 3 (0.50%) Stata
9 1 (0.17%) Adobe XD
9 1 (0.17%) Sketch
Business Applications
1 22 (3.65%) Dynamics CRM
2 12 (1.99%) Shopify
2 12 (1.99%) Sprinklr
3 5 (0.83%) SAP S/4HANA
4 4 (0.66%) SAP CO
4 4 (0.66%) SAP FI
4 4 (0.66%) SAP FI/CO
4 4 (0.66%) SAP IBP
5 3 (0.50%) Salesforce CRM
5 3 (0.50%) SAP APO
5 3 (0.50%) SAP ERP
6 2 (0.33%) Dynamics NAV
6 2 (0.33%) Magento
6 2 (0.33%) NetSuite
6 2 (0.33%) SAP CX
7 1 (0.17%) Dynamics AX
7 1 (0.17%) Dynamics GP
7 1 (0.17%) Primavera
7 1 (0.17%) SAP EWM
7 1 (0.17%) SAP MM
Cloud Services
1 132 (21.93%) Azure
2 119 (19.77%) Power Platform
3 31 (5.15%) Azure Data Factory
3 31 (5.15%) Microsoft 365
4 27 (4.49%) SaaS
5 26 (4.32%) Azure Synapse Analytics
6 23 (3.82%) Google Analytics
7 22 (3.65%) Azure DevOps
8 21 (3.49%) AWS
9 20 (3.32%) Entra ID
10 17 (2.82%) Dynamics 365
11 13 (2.16%) Boomi
12 12 (1.99%) Salesforce Commerce Cloud
13 9 (1.50%) Google Ads
13 9 (1.50%) Snowflake
14 8 (1.33%) PowerApps
15 7 (1.16%) Asana
15 7 (1.16%) Microsoft Copilot
16 6 (1.00%) Cloud Computing
16 6 (1.00%) Serverless
Communications & Networking
1 27 (4.49%) Network Security
2 17 (2.82%) Firewall
3 5 (0.83%) LAN
3 5 (0.83%) SAN
3 5 (0.83%) WAN
4 4 (0.66%) Ethernet
4 4 (0.66%) Wi-Fi
4 4 (0.66%) Wireshark
5 3 (0.50%) TCP/IP
6 2 (0.33%) Skype
6 2 (0.33%) VoIP
7 1 (0.17%) Cisco ASA
7 1 (0.17%) DNS
7 1 (0.17%) LoRaWAN
7 1 (0.17%) LTE
7 1 (0.17%) Modbus
7 1 (0.17%) NAS
7 1 (0.17%) NetScaler
7 1 (0.17%) SSL
7 1 (0.17%) VPN
Database & Business Intelligence
1 108 (17.94%) Power BI
2 44 (7.31%) Tableau
3 42 (6.98%) SQL Server
4 40 (6.64%) Data Lake
5 30 (4.98%) SQL Server Reporting Services
6 26 (4.32%) Azure SQL Database
7 19 (3.16%) Data Warehouse
8 7 (1.16%) Metadata
9 6 (1.00%) SQL Server Integration Services
10 4 (0.66%) Looker
10 4 (0.66%) Oracle BI Publisher
11 3 (0.50%) Amazon QuickSight
11 3 (0.50%) Elasticsearch
11 3 (0.50%) Relational Database
11 3 (0.50%) SQL Server Analysis Services
12 2 (0.33%) Amazon RDS
12 2 (0.33%) Azure SQL Data Warehouse
12 2 (0.33%) Crystal Reports
12 2 (0.33%) Metabase
12 2 (0.33%) MySQL
Development Applications
1 30 (4.98%) JIRA
2 6 (1.00%) Git
3 4 (0.66%) Postman
4 3 (0.50%) Jenkins
4 3 (0.50%) Octopus Deploy
5 2 (0.33%) Bazaar
5 2 (0.33%) GitLab
5 2 (0.33%) Selenium
5 2 (0.33%) Visual Studio
6 1 (0.17%) Appium
6 1 (0.17%) Cypress.io
6 1 (0.17%) JMeter
6 1 (0.17%) LoadRunner
6 1 (0.17%) MLflow
6 1 (0.17%) REST Assured
6 1 (0.17%) Team Foundation Server
6 1 (0.17%) WebDriver
General
1 602 (100.00%) Analytical Skills
2 371 (61.63%) Social Skills
3 261 (43.36%) Finance
4 146 (24.25%) Marketing
5 71 (11.79%) Retail
6 70 (11.63%) Law
7 51 (8.47%) Manufacturing
8 45 (7.48%) Legal
8 45 (7.48%) Public Sector
9 35 (5.81%) Influencing Skills
9 35 (5.81%) Presentation Skills
10 30 (4.98%) Electronics
11 29 (4.82%) Telecoms
12 21 (3.49%) Organisational Skills
13 17 (2.82%) Inclusion and Diversity
14 16 (2.66%) Games
15 15 (2.49%) Advertising
15 15 (2.49%) Billing
16 14 (2.33%) Banking
17 12 (1.99%) French Language
Job Titles
1 138 (22.92%) Analyst
2 96 (15.95%) Senior
3 69 (11.46%) Lead
4 45 (7.48%) Consultant
5 39 (6.48%) Data Analyst
6 29 (4.82%) Business Analyst
7 28 (4.65%) Architect
7 28 (4.65%) Commercial Analyst
8 27 (4.49%) Cybersecurity Consultant
8 27 (4.49%) Security Consultant
9 25 (4.15%) Support Engineer
10 22 (3.65%) Business Manager
11 19 (3.16%) Technical Engineer
11 19 (3.16%) Technical Support
11 19 (3.16%) Technical Support Engineer
12 16 (2.66%) Insight Analyst
13 15 (2.49%) Support Analyst
14 14 (2.33%) Developer
14 14 (2.33%) Graduate
14 14 (2.33%) Systems Analyst
Libraries, Frameworks & Software Standards
1 26 (4.32%) HTML
2 24 (3.99%) CSS
3 8 (1.33%) REST
4 6 (1.00%) .NET
5 4 (0.66%) GraphQL
5 4 (0.66%) Oracle Fusion
6 3 (0.50%) .NET Framework
6 3 (0.50%) EDI
6 3 (0.50%) Middleware
6 3 (0.50%) SAP Fiori
6 3 (0.50%) SOAP
6 3 (0.50%) XML
7 2 (0.33%) Elastic Stack
7 2 (0.33%) FIX Protocol
7 2 (0.33%) JSON
7 2 (0.33%) Sass
7 2 (0.33%) ZeroMQ
8 1 (0.17%) .NET Core
8 1 (0.17%) Apache NiFi
8 1 (0.17%) ModSecurity
Miscellaneous
1 51 (8.47%) Onboarding
1 51 (8.47%) Self-Motivation
2 45 (7.48%) Management Information System
3 39 (6.48%) FMCG
4 33 (5.48%) Data Centre
5 30 (4.98%) Product Ownership
6 29 (4.82%) Cloud Native
7 23 (3.82%) Social Media
8 19 (3.16%) Driving Licence
9 18 (2.99%) Enterprise Software
10 13 (2.16%) Data Structures
11 11 (1.83%) Algorithms
12 9 (1.50%) Legacy Systems
13 6 (1.00%) Credit Risk
13 6 (1.00%) Data Protection Act
13 6 (1.00%) IoT
13 6 (1.00%) Web Conferencing
14 5 (0.83%) Cyber Defence
15 4 (0.66%) CMDB
15 4 (0.66%) Security Posture
Operating Systems
1 16 (2.66%) Windows
2 6 (1.00%) Linux
3 3 (0.50%) Unix
3 3 (0.50%) Windows Server
4 1 (0.17%) Android
4 1 (0.17%) Oracle Linux
4 1 (0.17%) Ubuntu
4 1 (0.17%) VMS
Processes & Methodologies
1 269 (44.68%) Problem-Solving
2 234 (38.87%) Analytics
3 160 (26.58%) Continuous Improvement
4 155 (25.75%) Business Intelligence
5 135 (22.43%) Decision-Making
6 127 (21.10%) Agile
7 112 (18.60%) Actionable Insight
8 107 (17.77%) Project Management
9 101 (16.78%) CRM
10 92 (15.28%) ERP
11 82 (13.62%) AI
12 74 (12.29%) Stakeholder Management
13 70 (11.63%) Process Improvement
14 66 (10.96%) Roadmaps
15 65 (10.80%) Cybersecurity
16 64 (10.63%) Business Strategy
17 62 (10.30%) Visualisation
18 54 (8.97%) Change Management
18 54 (8.97%) Mentoring
19 50 (8.31%) Programme Management
Programming Languages
1 123 (20.43%) SQL
2 42 (6.98%) Python
3 25 (4.15%) JavaScript
4 24 (3.99%) Data Analysis Expressions
5 21 (3.49%) PowerShell
6 14 (2.33%) C#
7 8 (1.33%) C++
7 8 (1.33%) VBA
8 7 (1.16%) C
9 6 (1.00%) Bash
9 6 (1.00%) R
9 6 (1.00%) T-SQL
10 3 (0.50%) Java
10 3 (0.50%) MATLAB
10 3 (0.50%) PL/SQL
11 2 (0.33%) Bicep
11 2 (0.33%) Kusto Query Language
11 2 (0.33%) Perl
12 1 (0.17%) Go
12 1 (0.17%) TypeScript
Qualifications
1 147 (24.42%) Degree
2 49 (8.14%) Security Cleared
3 30 (4.98%) CISSP
4 27 (4.49%) CEH
5 25 (4.15%) CompTIA Security+
6 20 (3.32%) Master's Degree
6 20 (3.32%) SC Cleared
7 13 (2.16%) ACCA
7 13 (2.16%) PMI Certification
7 13 (2.16%) PMP
8 12 (1.99%) Microsoft Certification
8 12 (1.99%) Six Sigma Green Belt
9 11 (1.83%) CIMA
10 10 (1.66%) DBS Check
11 9 (1.50%) A+ Certification
11 9 (1.50%) CISM
11 9 (1.50%) Computer Science Degree
12 8 (1.33%) DV Cleared
12 8 (1.33%) MBA
13 7 (1.16%) ITIL Certification
Quality Assurance & Compliance
1 55 (9.14%) ISO/IEC 27001
2 35 (5.81%) NIST
3 27 (4.49%) Data Quality
4 26 (4.32%) PCI DSS
5 22 (3.65%) QA
6 18 (2.99%) GDPR
7 13 (2.16%) Actionable Recommendations
8 12 (1.99%) Accessibility
9 8 (1.33%) GRC
10 5 (0.83%) PMO
10 5 (0.83%) SLA
11 4 (0.66%) Cyber Essentials
11 4 (0.66%) ISO 14001
11 4 (0.66%) ISO 9001
11 4 (0.66%) NEBOSH
12 2 (0.33%) Cyber Essentials PLUS
12 2 (0.33%) EU AI Act
12 2 (0.33%) FINRA
12 2 (0.33%) IFRS
12 2 (0.33%) ISO/IEC 42001
System Software
1 16 (2.66%) Active Directory
2 12 (1.99%) Hyper-V
3 5 (0.83%) Firmware
4 4 (0.66%) Docker
5 2 (0.33%) VMware Infrastructure
Systems Management
1 15 (2.49%) Microsoft Intune
2 6 (1.00%) Terraform
3 3 (0.50%) Kubernetes
4 2 (0.33%) Ansible
4 2 (0.33%) Kibana
5 1 (0.17%) AirWatch
5 1 (0.17%) Computer Emergency Response Teams
5 1 (0.17%) Computer Incident Response Team
5 1 (0.17%) SCCM
5 1 (0.17%) SCOM
Vendors
1 132 (21.93%) Microsoft
2 69 (11.46%) SAP
3 47 (7.81%) Salesforce
4 39 (6.48%) Google
5 29 (4.82%) Adobe
6 19 (3.16%) Oracle
7 18 (2.99%) Dell
8 13 (2.16%) MuleSoft
9 11 (1.83%) Autodesk
10 7 (1.16%) Hotjar
10 7 (1.16%) ServiceNow
11 6 (1.00%) Cisco
11 6 (1.00%) Databricks
11 6 (1.00%) Facebook
11 6 (1.00%) Workday
12 5 (0.83%) Ahrefs
12 5 (0.83%) Screaming Frog
13 4 (0.66%) Guidewire
13 4 (0.66%) HubSpot
13 4 (0.66%) TikTok