People Management Jobs

People Management
UK

The table below provides summary statistics for permanent job vacancies requiring People Management skills. It includes a benchmarking guide to the annual salaries offered in vacancies that cited People Management over the 6 months leading up to 2 July 2025, comparing them to the same period in the previous two years.

6 months to
2 Jul 2025
Same period 2024 Same period 2023
Rank 276 303 192
Rank change year-on-year +27 -111 +80
Permanent jobs citing People Management 621 969 1,733
As % of all permanent jobs advertised in the UK 1.06% 0.90% 1.94%
As % of the Processes & Methodologies category 1.17% 1.09% 2.04%
Number of salaries quoted 390 605 640
10th Percentile £48,000 £33,640 £37,875
25th Percentile £59,813 £46,250 £51,250
Median annual salary (50th Percentile) £69,315 £60,000 £70,000
Median % change year-on-year +15.53% -14.29% -
75th Percentile £80,250 £82,500 £91,384
90th Percentile £105,125 £97,500 £106,250
UK excluding London median annual salary £69,315 £57,500 £62,500
% change year-on-year +20.55% -8.00% +4.17%

All Process and Methodology Skills
UK

People Management falls under the Processes and Methodologies category. For comparison with the information above, the following table provides summary statistics for all permanent job vacancies requiring process or methodology skills.

Permanent vacancies with a requirement for process or methodology skills 53,298 89,106 85,068
As % of all permanent jobs advertised in the UK 91.19% 82.51% 95.34%
Number of salaries quoted 27,465 61,429 52,805
10th Percentile £27,336 £29,750 £33,750
25th Percentile £38,500 £40,000 £45,000
Median annual salary (50th Percentile) £55,000 £55,000 £60,331
Median % change year-on-year - -8.84% +0.55%
75th Percentile £75,000 £72,500 £80,000
90th Percentile £96,250 £92,500 £100,000
UK excluding London median annual salary £50,000 £50,000 £55,000
% change year-on-year - -9.09% +4.76%

People Management
Job Vacancy Trend

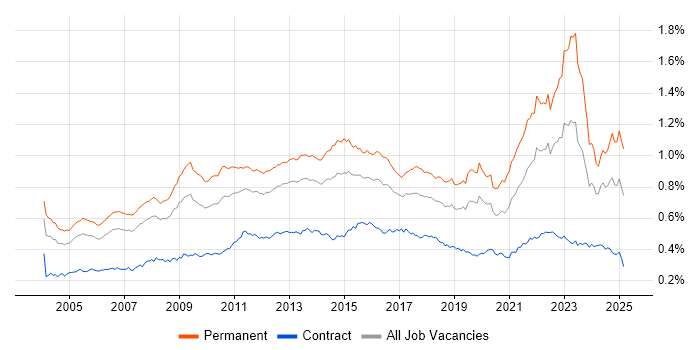
Job postings citing People Management as a proportion of all IT jobs advertised.

Job vacancy trend for People Management in the UK

People Management
Salary Trend

3-month moving average salary quoted in jobs citing People Management.

Salary trend for People Management in the UK

People Management
Salary Histogram

Salary distribution for jobs citing People Management over the 6 months to 2 July 2025.

Salary histogram for People Management in the UK

People Management
Top 17 Job Locations

The table below looks at the demand and provides a guide to the median salaries quoted in IT jobs citing People Management within the UK over the 6 months to 2 July 2025. The 'Rank Change' column provides an indication of the change in demand within each location based on the same 6 month period last year.

Location Rank Change
on Same Period
Last Year
Matching
Permanent
IT Job Ads
Median Salary
Past 6 Months
Median Salary
% Change
on Same Period
Last Year
Live
Jobs
England -1 588 £69,315 +12.15% 1,823
UK excluding London +63 462 £69,315 +20.55% 962
North of England +54 232 £69,315 +15.53% 291
North West +66 200 £69,315 +6.64% 175
London -28 153 £87,500 +25.00% 971
Work from Home +29 151 £77,500 +19.23% 828
South East +81 109 £72,500 +31.82% 218
Midlands +38 65 £72,500 +20.83% 120
West Midlands +68 51 £72,500 +11.54% 79
Yorkshire +16 32 £67,500 +17.39% 101
South West +33 17 £66,367 +15.42% 83
East of England +12 17 £62,000 +2.80% 108
East Midlands +10 14 £70,000 +43.59% 40
Scotland +79 10 £60,000 +4.35% 89
Wales +43 7 £35,500 -11.25% 37
Northern Ireland +44 3 - - 22
Channel Islands - 2 £78,750 -

People Management
Co-occurring Skills and Capabilities by Category

The follow tables expand on the table above by listing co-occurrences grouped by category. The same employment type, locality and period is covered with up to 20 co-occurrences shown in each of the following categories:

Application Platforms
1 6 (0.97%) Microsoft Exchange
2 5 (0.81%) SharePoint
3 2 (0.32%) Confluence
3 2 (0.32%) IIS
3 2 (0.32%) SAS
3 2 (0.32%) ThingWorx
4 1 (0.16%) Apache Airflow
4 1 (0.16%) CICS
4 1 (0.16%) SharePoint 2013
4 1 (0.16%) WebSphere
Applications
1 19 (3.06%) Microsoft Office
2 15 (2.42%) Microsoft Excel
3 7 (1.13%) Simulink
4 6 (0.97%) Microsoft PowerPoint
4 6 (0.97%) Microsoft Project
5 1 (0.16%) Adobe Creative Suite
5 1 (0.16%) Adobe Illustrator
5 1 (0.16%) Adobe Premiere
5 1 (0.16%) InDesign
5 1 (0.16%) Photoshop
Business Applications
1 4 (0.64%) ResourceLink
1 4 (0.64%) Salesforce CRM
2 3 (0.48%) Dynamics CRM
2 3 (0.48%) Primavera
2 3 (0.48%) SAP S/4HANA
3 2 (0.32%) Magento
3 2 (0.32%) Sage 200
4 1 (0.16%) Dynamics AX
4 1 (0.16%) Oracle EBS R12
4 1 (0.16%) Oracle Procure-to-Pay
Cloud Services
1 58 (9.34%) Azure
2 55 (8.86%) AWS
3 30 (4.83%) Power Platform
4 27 (4.35%) SaaS
5 12 (1.93%) Microsoft 365
6 8 (1.29%) Amazon S3
7 7 (1.13%) Amazon CloudWatch
7 7 (1.13%) Amazon EC2
7 7 (1.13%) GCP
7 7 (1.13%) Google Analytics
7 7 (1.13%) Virtual Private Cloud
8 6 (0.97%) Dynamics 365
8 6 (0.97%) PaaS
9 4 (0.64%) Adobe Analytics
9 4 (0.64%) Azure Synapse Analytics
9 4 (0.64%) Cloud Computing
9 4 (0.64%) Collibra
10 3 (0.48%) Amazon SQS
10 3 (0.48%) AWS Lambda
10 3 (0.48%) Serverless
Communications & Networking
1 16 (2.58%) Structured Cabling
2 12 (1.93%) Firewall
3 10 (1.61%) LAN
3 10 (1.61%) VPN
3 10 (1.61%) WAN
4 9 (1.45%) FTP
4 9 (1.45%) HTTP
4 9 (1.45%) SMTP
4 9 (1.45%) TCP/IP
5 8 (1.29%) Network Security
6 7 (1.13%) Internet
7 4 (0.64%) Wi-Fi
8 2 (0.32%) DHCP
8 2 (0.32%) DNS
9 1 (0.16%) BGP
9 1 (0.16%) Cisco Nexus
9 1 (0.16%) EIGRP
9 1 (0.16%) OSPF
9 1 (0.16%) VoIP
9 1 (0.16%) Wireless
Database & Business Intelligence
1 21 (3.38%) Power BI
2 18 (2.90%) Tableau
3 13 (2.09%) Data Warehouse
4 11 (1.77%) Relational Database
5 7 (1.13%) PostgreSQL
6 6 (0.97%) SQL Server
7 5 (0.81%) Electronic Patient Records
8 4 (0.64%) Ataccama
8 4 (0.64%) Looker
8 4 (0.64%) Metadata
8 4 (0.64%) Metadata Repository
9 3 (0.48%) Amazon RDS
9 3 (0.48%) Data Lake
10 2 (0.32%) Oracle Database
11 1 (0.16%) Big Data
11 1 (0.16%) DB2
11 1 (0.16%) Power Query
11 1 (0.16%) Redis
Development Applications
1 9 (1.45%) JIRA
2 4 (0.64%) ER Studio
3 3 (0.48%) Git
3 3 (0.48%) WaveMaker
4 2 (0.32%) Jenkins
4 2 (0.32%) Postman
4 2 (0.32%) SoapUI
4 2 (0.32%) webpack
5 1 (0.16%) Bitbucket
5 1 (0.16%) Selenium
5 1 (0.16%) Sonatype Nexus
General
1 285 (45.89%) Social Skills
2 194 (31.24%) Finance
3 67 (10.79%) Analytical Skills
4 63 (10.14%) Inclusion and Diversity
5 53 (8.53%) Marketing
6 50 (8.05%) Retail
7 40 (6.44%) Law
8 37 (5.96%) Banking
9 36 (5.80%) Legal
10 27 (4.35%) Aerospace
11 26 (4.19%) Presentation Skills
12 23 (3.70%) Front Office
13 22 (3.54%) Automotive
14 20 (3.22%) Organisational Skills
14 20 (3.22%) Telecoms
15 12 (1.93%) Influencing Skills
16 11 (1.77%) Advertising
17 8 (1.29%) Manufacturing
17 8 (1.29%) Public Sector
18 7 (1.13%) Electronics
Job Titles
1 110 (17.71%) Commissioning Manager
2 95 (15.30%) Lead
3 89 (14.33%) Senior
4 56 (9.02%) Engineering Manager
5 52 (8.37%) Senior Manager
6 30 (4.83%) Systems Engineer
7 26 (4.19%) Data Manager
8 22 (3.54%) Head of Analytics
8 22 (3.54%) Software Engineering Manager
8 22 (3.54%) Software Manager
9 21 (3.38%) Development Manager
10 20 (3.22%) Lead Systems Engineer
10 20 (3.22%) Radar Engineer
11 18 (2.90%) Delivery Manager
11 18 (2.90%) Head of AI
11 18 (2.90%) Risk Manager
11 18 (2.90%) Technology Risk Manager
12 17 (2.74%) Support Manager
12 17 (2.74%) Team Leader
13 16 (2.58%) Head of IT
Libraries, Frameworks & Software Standards
1 22 (3.54%) .NET
2 12 (1.93%) React
3 10 (1.61%) REST
4 8 (1.29%) LDAP
5 7 (1.13%) CSS
6 6 (0.97%) Spring
6 6 (0.97%) Spring Boot
7 5 (0.81%) AngularJS
7 5 (0.81%) HTML
7 5 (0.81%) Vue
8 4 (0.64%) Android Jetpack
8 4 (0.64%) Hibernate
8 4 (0.64%) Jetpack Compose
8 4 (0.64%) SwiftUI
8 4 (0.64%) Web Services
9 3 (0.48%) .NET Framework
9 3 (0.48%) Laravel
9 3 (0.48%) Serverless Framework
10 2 (0.32%) .NET Core
10 2 (0.32%) Node.js
Miscellaneous
1 45 (7.25%) Product Ownership
2 24 (3.86%) Management Information System
3 19 (3.06%) Derivative
4 17 (2.74%) Blockchain
4 17 (2.74%) Robotics
5 16 (2.58%) Distributed Systems
6 14 (2.25%) Greenfield Project
7 12 (1.93%) NHS
8 11 (1.77%) Data Centre
8 11 (1.77%) Virtual Team
9 10 (1.61%) Self-Motivation
10 9 (1.45%) Client/Server
10 9 (1.45%) Onboarding
10 9 (1.45%) Security Operations Centre
11 8 (1.29%) Cloud Native
12 7 (1.13%) Analogue Electronics
12 7 (1.13%) Data Protection Act
13 6 (0.97%) Digital Media
13 6 (0.97%) Driving Licence
13 6 (0.97%) Multi-touch
Operating Systems
1 24 (3.86%) Windows
2 5 (0.81%) Android
2 5 (0.81%) Apple iOS
3 3 (0.48%) Linux
4 2 (0.32%) Red Hat Enterprise Linux
4 2 (0.32%) Windows 10
4 2 (0.32%) Windows Server
4 2 (0.32%) Windows Server 2016
Processes & Methodologies
1 181 (29.15%) Agile
2 128 (20.61%) Mentoring
3 121 (19.48%) Coaching
4 114 (18.36%) Performance Optimisation
5 104 (16.75%) Analytics
6 95 (15.30%) Stakeholder Management
7 84 (13.53%) Roadmaps
8 82 (13.20%) Line Management
9 76 (12.24%) Project Delivery
10 75 (12.08%) Project Management
11 74 (11.92%) Performance Management
12 68 (10.95%) Risk Management
13 63 (10.14%) Continuous Improvement
14 62 (9.98%) Software Engineering
15 61 (9.82%) Problem-Solving
16 51 (8.21%) Decision-Making
17 47 (7.57%) Artificial Intelligence
18 46 (7.41%) Service Delivery
19 44 (7.09%) Stakeholder Engagement
20 40 (6.44%) Creative Thinking
Programming Languages
1 39 (6.28%) Python
2 38 (6.12%) Java
3 36 (5.80%) C#
4 32 (5.15%) SQL
5 27 (4.35%) MATLAB
6 19 (3.06%) JavaScript
7 14 (2.25%) R
8 11 (1.77%) PowerShell
9 7 (1.13%) Bash
9 7 (1.13%) C++
10 6 (0.97%) Perl
10 6 (0.97%) TypeScript
11 4 (0.64%) Swift
12 3 (0.48%) PHP
12 3 (0.48%) VB.NET
13 1 (0.16%) ActionScript
13 1 (0.16%) ActionScript 2.0
13 1 (0.16%) Shell Script
13 1 (0.16%) T-SQL
13 1 (0.16%) X++
Qualifications
1 230 (37.04%) Degree
2 161 (25.93%) BPSS Clearance
3 131 (21.10%) Master's Degree
4 110 (17.71%) MBA
5 39 (6.28%) Security Cleared
6 28 (4.51%) SC Cleared
7 25 (4.03%) DV Cleared
8 18 (2.90%) PMP
9 15 (2.42%) PMI Certification
10 14 (2.25%) Computer Science Degree
11 12 (1.93%) CISM
11 12 (1.93%) CISSP
12 11 (1.77%) CRISC
13 10 (1.61%) Azure Certification
13 10 (1.61%) Numerate Degree
14 7 (1.13%) HND
15 6 (0.97%) DBS Check
16 5 (0.81%) AWS Certification
17 4 (0.64%) PhD
17 4 (0.64%) Postgraduate
Quality Assurance & Compliance
1 26 (4.19%) QA
2 21 (3.38%) SLA
3 17 (2.74%) ISO/IEC 27001
3 17 (2.74%) ITGC
4 14 (2.25%) Accessibility
5 12 (1.93%) Data Quality
6 11 (1.77%) NIST
7 10 (1.61%) Cyber Essentials
8 8 (1.29%) GDPR
9 7 (1.13%) Cyber Essentials PLUS
9 7 (1.13%) GRC
9 7 (1.13%) ISO/IEC 27002 (supersedes ISO/IEC 17799)
10 5 (0.81%) PMO
11 4 (0.64%) COBIT
12 2 (0.32%) IEC 62304
12 2 (0.32%) ISO 13485
12 2 (0.32%) ISO 9001
12 2 (0.32%) PCI DSS
13 1 (0.16%) Disclosure Scotland
13 1 (0.16%) IFRS
System Software
1 30 (4.83%) Active Directory
2 7 (1.13%) Docker
3 2 (0.32%) Hyper-V
4 1 (0.16%) Firmware
4 1 (0.16%) RACF
4 1 (0.16%) Virtual Machines
Systems Management
1 10 (1.61%) SCCM
2 9 (1.45%) Kubernetes
3 8 (1.29%) Terraform
4 7 (1.13%) QRadar
5 4 (0.64%) Ansible
5 4 (0.64%) Microsoft Intune
6 2 (0.32%) Microsoft Data Protection Manager
6 2 (0.32%) SCOM
6 2 (0.32%) WSUS
7 1 (0.16%) Active Directory Federation Services
7 1 (0.16%) Grafana
7 1 (0.16%) Single Sign-On
Vendors
1 90 (14.49%) Microsoft
2 18 (2.90%) Google
3 11 (1.77%) Adobe
3 11 (1.77%) SAP
3 11 (1.77%) ServiceNow
4 10 (1.61%) Cisco
4 10 (1.61%) Databricks
4 10 (1.61%) Splunk
4 10 (1.61%) TikTok
5 7 (1.13%) Mentor Graphics
5 7 (1.13%) Oracle
6 6 (0.97%) Yahoo!
7 5 (0.81%) Apple
7 5 (0.81%) Salesforce
8 4 (0.64%) Cognos
8 4 (0.64%) HP
9 3 (0.48%) Pinterest
9 3 (0.48%) Sage
10 2 (0.32%) Alteryx
10 2 (0.32%) Red Hat