ISACA Certified in Risk and Information Systems Control (CRISC)
UK

The table below provides summary statistics for permanent job vacancies with a requirement for CRISC qualifications. It includes a benchmarking guide to the salaries offered over the 6 months leading up to 6 October 2026, comparing them to the same period in the previous two years.

6 months to
6 Oct 2026
Same period 2025 Same period 2024
Rank 675 544 652
Rank change year-on-year -131 +108 -60
Permanent jobs citing CRISC 143 122 117
As % of all permanent jobs in the UK 0.12% 0.25% 0.16%
As % of the Qualifications category 0.70% 0.70% 0.57%
Number of salaries quoted 96 54 46
10th Percentile £51,525 £50,648 £50,625
25th Percentile £60,781 £55,625 £58,125
Median annual salary (50th Percentile) £75,000 £81,250 £76,250
Median % change year-on-year -7.69% +6.56% +8.93%
75th Percentile £82,631 £106,875 £90,000
90th Percentile £90,000 £135,000 £100,000
UK excluding London median annual salary £65,000 £60,000 £65,000
% change year-on-year +8.33% -7.69% +5.69%

All Academic and Professional Certifications
UK

CRISC falls under the Academic Qualifications and Professional Certifications category. For comparison with the information above, the following table provides summary statistics for all permanent job vacancies requiring academic qualifications or professional certifications.

Permanent vacancies requiring academic qualifications or professional certifications 20,575 17,471 20,578
As % of all permanent jobs advertised in the UK 17.39% 35.26% 28.07%
Number of salaries quoted 11,518 7,400 8,844
10th Percentile £32,000 £29,000 £31,250
25th Percentile £43,903 £36,250 £42,500
Median annual salary (50th Percentile) £60,000 £55,000 £57,500
Median % change year-on-year +9.09% -4.35% -0.86%
75th Percentile £80,000 £73,750 £75,000
90th Percentile £97,500 £90,000 £90,000
UK excluding London median annual salary £56,500 £47,500 £52,500
% change year-on-year +18.95% -9.52% -

CRISC
Job Vacancy Trend

Historical trend showing the proportion of permanent IT job postings citing CRISC relative to all permanent IT jobs advertised.

CRISC job vacancy trend in the UK

CRISC
Salary Trend

Salary distribution trend for jobs in the UK citing CRISC.
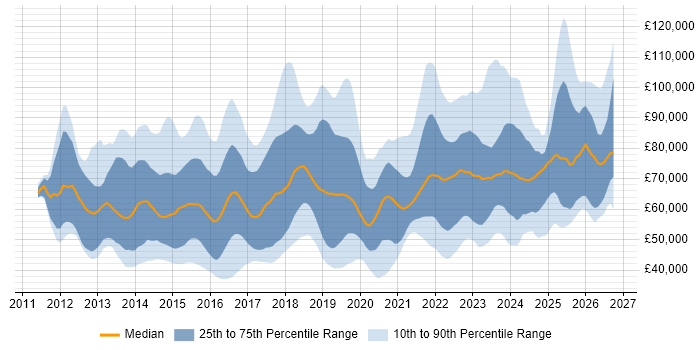
Salary distribution trend for jobs in the UK citing CRISC

CRISC
Salary Histogram

Salary distribution for jobs citing CRISC over the 6 months to 6 October 2026.

Salary histogram for CRISC in the UK

CRISC
Top 14 Job Locations

The table below looks at the demand and provides a guide to the median salaries quoted in IT jobs citing CRISC within the UK over the 6 months to 6 October 2026. The 'Rank Change' column provides an indication of the change in demand within each location based on the same 6 month period last year.

Location Rank Change
on Same Period
Last Year
Matching
Permanent
IT Job Ads
Median Salary
Past 6 Months
Median Salary
% Change
on Same Period
Last Year
Live
Jobs
England -108 132 £75,000 -11.76% 152
London -73 70 £80,000 -11.11% 89
UK excluding London -123 65 £65,000 +8.33% 70
Work from Home -12 62 £75,000 +7.14% 60
South East -41 19 £59,428 -8.57% 24
South West -62 18 £75,000 +42.86% 7
West Midlands -27 12 £53,600 +3.30% 4
Midlands -51 12 £53,600 +3.30% 6
North of England -67 6 £60,000 - 16
East of England - 6 £62,300 - 8
North West -30 5 £60,000 - 9
Scotland -3 3 - - 6
Yorkshire -33 1 £72,500 +31.82% 6
Wales -67 1 - -

CRISC
Co-Occurring Skills & Capabilities by Category

The following tables expand on the one above by listing co-occurrences grouped by category. They cover the same employment type, locality and period, with up to 20 co-occurrences shown in each category:

Application Platforms
1 1 (0.70%) IIS
1 1 (0.70%) SharePoint
1 1 (0.70%) WebLogic
Applications
1 6 (4.20%) Microsoft Office
2 3 (2.10%) Microsoft Excel
2 3 (2.10%) Microsoft PowerPoint
Business Applications
1 1 (0.70%) FLEXCUBE
Cloud Services
1 23 (16.08%) SaaS
2 19 (13.29%) Azure
3 17 (11.89%) AWS
4 9 (6.29%) Microsoft 365
5 8 (5.59%) GCP
6 6 (4.20%) Dynamics 365
7 5 (3.50%) Power Platform
8 1 (0.70%) Azure Sentinel
8 1 (0.70%) Google Workspace
8 1 (0.70%) Serverless
Communications & Networking
1 7 (4.90%) Network Security
2 1 (0.70%) Firewall
2 1 (0.70%) VPN
Database & Business Intelligence
1 5 (3.50%) Power BI
Development Applications
1 2 (1.40%) Yeoman
2 1 (0.70%) JIRA
General
1 72 (50.35%) Finance
2 66 (46.15%) Social Skills
3 42 (29.37%) Analytical Skills
4 22 (15.38%) Banking
5 20 (13.99%) Inclusion and Diversity
6 18 (12.59%) Legal
7 15 (10.49%) Organisational Skills
7 15 (10.49%) Retail
8 10 (6.99%) Financial Institution
9 9 (6.29%) Back Office
9 9 (6.29%) Influencing Skills
9 9 (6.29%) Public Sector
10 8 (5.59%) Local Government
11 7 (4.90%) French Language
11 7 (4.90%) German Language
12 5 (3.50%) Telecoms
13 4 (2.80%) Law
14 3 (2.10%) Games
15 2 (1.40%) Military
16 1 (0.70%) Investment Banking
Job Titles
1 36 (25.17%) Consultant
2 30 (20.98%) Security Consultant
3 21 (14.69%) Lead
4 16 (11.19%) Senior
5 15 (10.49%) Cybersecurity Consultant
6 12 (8.39%) Senior Consultant
7 9 (6.29%) Analyst
7 9 (6.29%) Principal Consultant
7 9 (6.29%) Principal Security Consultant
8 8 (5.59%) Information Officer
8 8 (5.59%) Information Security Officer
8 8 (5.59%) IT Manager
8 8 (5.59%) Security Manager
8 8 (5.59%) Security Officer
9 7 (4.90%) Risk Manager
9 7 (4.90%) Senior Security Consultant
10 6 (4.20%) Head of Compliance
10 6 (4.20%) Information Security Advisor
10 6 (4.20%) Security Advisor
11 5 (3.50%) Resilience Manager
Libraries, Frameworks & Software Standards
1 5 (3.50%) ModSecurity
Miscellaneous
1 37 (25.87%) Management Information System
2 19 (13.29%) Security Posture
3 10 (6.99%) Cyber Threat
4 8 (5.59%) Cloud Native
4 8 (5.59%) Data Protection Act
5 7 (4.90%) Freedom of Information
5 7 (4.90%) Freedom of Information Act
5 7 (4.90%) Self-Motivation
6 5 (3.50%) Operational Technology
6 5 (3.50%) Product Ownership
6 5 (3.50%) Team-Oriented Environment
7 3 (2.10%) Analytical Mindset
7 3 (2.10%) SWIFT Messaging Network
8 2 (1.40%) Cyber Security Posture
8 2 (1.40%) NHS
9 1 (0.70%) Cyber Defence
9 1 (0.70%) Embedded Systems
9 1 (0.70%) Onboarding
9 1 (0.70%) Smart Meter
9 1 (0.70%) Smartcard
Processes & Methodologies
1 113 (79.02%) Risk Management
2 108 (75.52%) Cybersecurity
3 88 (61.54%) Information Security
4 45 (31.47%) Continuous Improvement
5 44 (30.77%) Stakeholder Management
6 31 (21.68%) Problem-Solving
7 28 (19.58%) Risk Register
8 26 (18.18%) Decision-Making
9 25 (17.48%) Cloud Security
9 25 (17.48%) Project Management
10 24 (16.78%) Business Continuity
10 24 (16.78%) Data Protection
10 24 (16.78%) Information Security Governance
10 24 (16.78%) Risk Assessment
11 23 (16.08%) Security Management
12 21 (14.69%) Stakeholder Engagement
13 20 (13.99%) Regulatory Compliance
14 19 (13.29%) Agile
14 19 (13.29%) GAP Analysis
15 18 (12.59%) Vulnerability Management
Qualifications
1 127 (88.81%) CISSP
2 112 (78.32%) CISM
3 50 (34.97%) CISA
4 38 (26.57%) Security Cleared
5 32 (22.38%) ISO 27001 Lead Implementer
6 20 (13.99%) ISO 27001 Lead Auditor
7 18 (12.59%) Degree
7 18 (12.59%) SC Cleared
8 17 (11.89%) DV Cleared
9 12 (8.39%) ISACA
10 10 (6.99%) (ISC)2 CCSP
10 10 (6.99%) Cisco Certification
11 7 (4.90%) CCSP
11 7 (4.90%) CISMP
12 5 (3.50%) CESG Certified Professional
12 5 (3.50%) DBS Check
13 4 (2.80%) CompTIA Security+
13 4 (2.80%) PCI QSA
14 3 (2.10%) CEH
14 3 (2.10%) GIAC
Quality Assurance & Compliance
1 108 (75.52%) ISO/IEC 27001
2 99 (69.23%) NIST
3 65 (45.45%) GRC
4 41 (28.67%) GDPR
5 28 (19.58%) COBIT
6 25 (17.48%) Cyber Essentials
6 25 (17.48%) PCI DSS
7 18 (12.59%) ISO/IEC 27005
7 18 (12.59%) NCSC
7 18 (12.59%) SOC 2
8 11 (7.69%) JSP 440
8 11 (7.69%) Sarbanes-Oxley
9 10 (6.99%) ISO 31000
9 10 (6.99%) NIST 800
9 10 (6.99%) QA
10 7 (4.90%) SOC 1
11 6 (4.20%) Cyber Essentials PLUS
11 6 (4.20%) ISO/IEC 27002 (supersedes ISO/IEC 17799)
11 6 (4.20%) ITGC
12 4 (2.80%) ISO 22301
Systems Management
1 1 (0.70%) RSA Archer
1 1 (0.70%) Single Sign-On
Vendors
1 9 (6.29%) Microsoft
2 8 (5.59%) Google
3 7 (4.90%) Oracle
4 6 (4.20%) IFS
4 6 (4.20%) SAP
5 4 (2.80%) OneTrust
6 3 (2.10%) Splunk
7 2 (1.40%) CA Agile Central
7 2 (1.40%) ServiceNow
8 1 (0.70%) Arqiva
8 1 (0.70%) OneLogin
8 1 (0.70%) Red Hat