Stakeholder Engagement
UK

The following table provides summary statistics for permanent job vacancies with a requirement for Stakeholder Engagement skills. Included is a benchmarking guide to the salaries offered in vacancies that have cited Stakeholder Engagement over the 6 months to 28 November 2023 with a comparison to the same period in the previous 2 years.

6 months to
28 Nov 2023
Same period 2022 Same period 2021
Rank 296 335 436
Rank change year-on-year +39 +101 -37
Permanent jobs citing Stakeholder Engagement 568 1,363 933
As % of all permanent jobs advertised in the UK 1.05% 1.09% 0.73%
As % of the Processes & Methodologies category 1.11% 1.13% 0.76%
Number of salaries quoted 428 913 693
10th Percentile £38,617 £42,455 £36,250
25th Percentile £51,500 £51,018 £42,999
Median annual salary (50th Percentile) £65,000 £64,000 £57,500
Median % change year-on-year +1.56% +11.30% -4.17%
75th Percentile £77,500 £78,750 £77,000
90th Percentile £90,000 £94,750 £95,000
UK excluding London median annual salary £59,556 £55,000 £52,500
% change year-on-year +8.28% +4.76% -4.55%

All Process and Methodology Skills
UK

Stakeholder Engagement is in the Processes and Methodologies category. The following table is for comparison with the above and provides summary statistics for all permanent job vacancies with a requirement for process or methodology skills.

Permanent vacancies with a requirement for process or methodology skills 51,121 120,104 122,523
As % of all permanent jobs advertised in the UK 94.09% 95.72% 95.43%
Number of salaries quoted 36,956 73,203 81,032
10th Percentile £32,500 £34,313 £32,500
25th Percentile £43,750 £45,000 £42,500
Median annual salary (50th Percentile) £60,000 £60,000 £59,000
Median % change year-on-year - +1.69% +7.27%
75th Percentile £80,000 £81,250 £77,500
90th Percentile £98,750 £100,000 £95,000
UK excluding London median annual salary £52,500 £53,000 £50,000
% change year-on-year -0.94% +6.00% +4.17%

Stakeholder Engagement
Job Vacancy Trend

Job postings citing Stakeholder Engagement as a proportion of all IT jobs advertised.
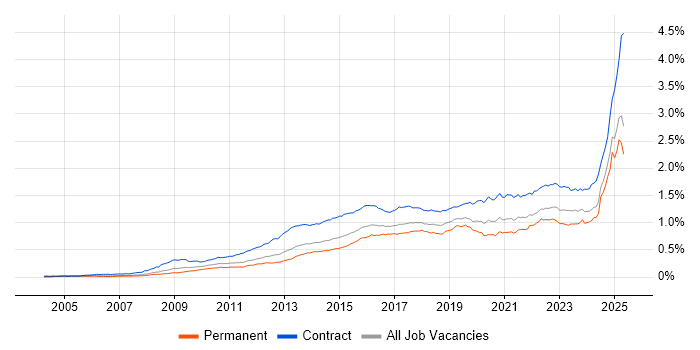
Job vacancy trend for Stakeholder Engagement in the UK

Stakeholder Engagement
Salary Trend

3-month moving average salary quoted in jobs citing Stakeholder Engagement.

Salary trend for Stakeholder Engagement in the UK

Stakeholder Engagement
Salary Histogram

Salary distribution for jobs citing Stakeholder Engagement over the 6 months to 28 November 2023.

Salary histogram for Stakeholder Engagement in the UK

Stakeholder Engagement
Top 17 Job Locations

The table below looks at the demand and provides a guide to the median salaries quoted in IT jobs citing Stakeholder Engagement within the UK over the 6 months to 28 November 2023. The 'Rank Change' column provides an indication of the change in demand within each location based on the same 6 month period last year.

Location Rank Change
on Same Period
Last Year
Matching
Permanent
IT Job Ads
Median Salary
Past 6 Months
Median Salary
% Change
on Same Period
Last Year
Live
Jobs
England +40 512 £65,000 - 358
UK excluding London +42 334 £59,556 +8.28% 238
Work from Home +8 224 £65,250 +0.38% 178
London +35 207 £70,000 +1.45% 145
North of England +109 134 £59,556 +8.28% 61
Yorkshire +105 86 £59,556 +13.44% 26
South East +52 55 £55,000 -20.16% 60
North West +81 46 £60,000 - 31
South West +24 40 £62,500 +8.92% 36
East of England +113 37 £12,500 -77.27% 18
Midlands +30 30 £60,000 +14.29% 48
Scotland +18 26 £59,556 +8.52% 14
West Midlands +27 21 £67,500 +25.32% 35
East Midlands +32 9 £48,788 -7.07% 11
Wales -1 6 £69,020 +97.20% 6
Northern Ireland - 6 £65,000 - 2
North East +36 2 - - 4

Stakeholder Engagement
Co-occurring Skills and Capabilities by Category

The follow tables expand on the table above by listing co-occurrences grouped by category. The same employment type, locality and period is covered with up to 20 co-occurrences shown in each of the following categories:

Application Platforms
1 11 (1.94%) SharePoint
2 3 (0.53%) Confluence
3 2 (0.35%) Apache Spark
3 2 (0.35%) Oracle SOA Suite
3 2 (0.35%) SAS
4 1 (0.18%) Apache Airflow
4 1 (0.18%) CMS
4 1 (0.18%) NetWeaver
Applications
1 19 (3.35%) Microsoft Office
2 16 (2.82%) Microsoft PowerPoint
3 15 (2.64%) Microsoft Excel
4 11 (1.94%) Microsoft Project
5 9 (1.58%) MS Visio
6 2 (0.35%) Adobe Illustrator
6 2 (0.35%) Photoshop
7 1 (0.18%) Adobe Creative Suite
7 1 (0.18%) InDesign
Business Applications
1 9 (1.58%) SAP S/4HANA
2 6 (1.06%) SAP CO
2 6 (1.06%) SAP FI
2 6 (1.06%) SAP FI/CO
3 4 (0.70%) Dynamics CRM
3 4 (0.70%) Infor M3
3 4 (0.70%) SAP ERP
4 2 (0.35%) Oracle ERP
4 2 (0.35%) SAP Business One
4 2 (0.35%) SAP SD
4 2 (0.35%) Sparx Enterprise Architect
5 1 (0.18%) NetSuite
5 1 (0.18%) Sage X3
5 1 (0.18%) Salesforce CRM
5 1 (0.18%) SAP MDG
Cloud Services
1 62 (10.92%) Azure
2 42 (7.39%) Power Platform
3 40 (7.04%) AWS
4 38 (6.69%) Microsoft 365
5 27 (4.75%) Dynamics 365
6 18 (3.17%) PowerApps
7 15 (2.64%) Entra ID
8 12 (2.11%) Figma
9 10 (1.76%) PaaS
9 10 (1.76%) SaaS
10 8 (1.41%) IaaS
11 6 (1.06%) Azure Logic Apps
11 6 (1.06%) Snowflake
12 5 (0.88%) Azure DevOps
12 5 (0.88%) OneDrive
12 5 (0.88%) Serverless
13 4 (0.70%) Azure Cognitive Services
13 4 (0.70%) Azure Functions
13 4 (0.70%) Cloud Computing
13 4 (0.70%) Power Automate
Communications & Networking
1 13 (2.29%) Intranet
2 9 (1.58%) Firewall
3 5 (0.88%) Internet
3 5 (0.88%) VPN
4 4 (0.70%) DHCP
4 4 (0.70%) DNS
4 4 (0.70%) LAN
4 4 (0.70%) WAN
5 3 (0.53%) Network Security
6 2 (0.35%) Intrusion Detection
7 1 (0.18%) Broadband
7 1 (0.18%) Cisco ASA
7 1 (0.18%) Mobile Broadband
7 1 (0.18%) TCP/IP
7 1 (0.18%) VLAN
7 1 (0.18%) Wi-Fi
7 1 (0.18%) Wireless
Database & Business Intelligence
1 29 (5.11%) Power BI
2 28 (4.93%) Data Hub
3 15 (2.64%) MySQL
4 11 (1.94%) PostgreSQL
5 10 (1.76%) Data Warehouse
6 7 (1.23%) Metadata
7 6 (1.06%) SQL Server
8 5 (0.88%) SQL Server Integration Services
8 5 (0.88%) Tableau
9 4 (0.70%) EDMS
9 4 (0.70%) SQL Server Reporting Services
10 3 (0.53%) Azure SQL Database
10 3 (0.53%) Data Lake
11 2 (0.35%) Amazon Redshift
11 2 (0.35%) Big Data
11 2 (0.35%) Hadoop
11 2 (0.35%) NoSQL
11 2 (0.35%) Qlik Sense
11 2 (0.35%) Tableau Desktop
12 1 (0.18%) SAP BW
Development Applications
1 20 (3.52%) Git
2 12 (2.11%) Jenkins
3 11 (1.94%) Bitbucket
3 11 (1.94%) JIRA
4 6 (1.06%) GitLab
5 2 (0.35%) ERwin
6 1 (0.18%) Balsamiq
6 1 (0.18%) LSMW
6 1 (0.18%) Selenium
6 1 (0.18%) SQL Server Management Studio (SSMS)
6 1 (0.18%) Subversion
6 1 (0.18%) Visual Studio
General
1 210 (36.97%) Finance
2 196 (34.51%) Social Skills
3 95 (16.73%) Analytical Skills
4 60 (10.56%) Banking
5 46 (8.10%) Public Sector
6 39 (6.87%) Influencing Skills
7 33 (5.81%) Retail
8 32 (5.63%) Manufacturing
9 27 (4.75%) Legal
10 23 (4.05%) Social Housing
11 19 (3.35%) Marketing
12 16 (2.82%) Inclusion and Diversity
13 13 (2.29%) Games
13 13 (2.29%) Law
14 12 (2.11%) Local Government
14 12 (2.11%) Presentation Skills
15 11 (1.94%) Tech for Good
16 10 (1.76%) Organisational Skills
17 7 (1.23%) Back Office
17 7 (1.23%) Investment Banking
Job Titles
1 107 (18.84%) Analyst
2 61 (10.74%) Senior
3 53 (9.33%) Architect
3 53 (9.33%) Consultant
3 53 (9.33%) Project Manager
4 52 (9.15%) Lead
5 35 (6.16%) Business Analyst
6 28 (4.93%) Developer
7 25 (4.40%) Systems Analyst
8 23 (4.05%) Administrator
8 23 (4.05%) ICT Administrator
8 23 (4.05%) Senior Analyst
8 23 (4.05%) Technical Architect
9 22 (3.87%) IT Manager
10 17 (2.99%) Data Analyst
11 16 (2.82%) Banking Analyst
11 16 (2.82%) Business Manager
12 15 (2.64%) Solutions Architect
13 14 (2.46%) Business Systems Analyst
14 13 (2.29%) Senior Manager
Libraries, Frameworks & Software Standards
1 17 (2.99%) CSS
1 17 (2.99%) HTML
2 16 (2.82%) AngularJS
3 12 (2.11%) HTML5
3 12 (2.11%) Spring Boot
4 11 (1.94%) Spring
5 9 (1.58%) .NET
6 8 (1.41%) ModSecurity
7 7 (1.23%) Velocity
8 6 (1.06%) Node.js
8 6 (1.06%) React
9 5 (0.88%) RESTful
10 4 (0.70%) ASP.NET
11 3 (0.53%) .NET Framework
11 3 (0.53%) EDI
11 3 (0.53%) jQuery
11 3 (0.53%) JSON
11 3 (0.53%) Middleware
11 3 (0.53%) SOAP
11 3 (0.53%) XML
Miscellaneous
1 40 (7.04%) Product Ownership
2 20 (3.52%) Management Information System
3 18 (3.17%) Greenfield Project
4 10 (1.76%) Onboarding
5 9 (1.58%) Data Centre
6 8 (1.41%) Self-Motivation
7 7 (1.23%) NHS
7 7 (1.23%) Renewable Energy
8 6 (1.06%) Cloud Native
8 6 (1.06%) Robotics
8 6 (1.06%) Virtual Team
9 5 (0.88%) Public Cloud
10 4 (0.70%) Enterprise Software
10 4 (0.70%) iPhone
10 4 (0.70%) PMI
11 3 (0.53%) Analytical Mindset
11 3 (0.53%) Blog
11 3 (0.53%) Data Structures
11 3 (0.53%) e-Learning
11 3 (0.53%) Low-Code
Operating Systems
1 27 (4.75%) Windows
2 21 (3.70%) Apple iOS
3 17 (2.99%) Android
4 14 (2.46%) Windows Server
5 6 (1.06%) Windows Server 2016
6 4 (0.70%) Linux
6 4 (0.70%) Windows Server 2019
7 2 (0.35%) Windows 10
8 1 (0.18%) Mac OS
8 1 (0.18%) Solaris
8 1 (0.18%) Unix
Processes & Methodologies
1 197 (34.68%) Agile
2 120 (21.13%) Project Management
3 107 (18.84%) Stakeholder Management
4 99 (17.43%) Continuous Improvement
5 93 (16.37%) Analytics
6 84 (14.79%) Roadmaps
7 77 (13.56%) Problem-Solving
8 72 (12.68%) Project Delivery
9 70 (12.32%) Decision-Making
10 60 (10.56%) Cybersecurity
11 51 (8.98%) Change Management
12 48 (8.45%) Data Analytics
13 47 (8.27%) Business Intelligence
14 46 (8.10%) Business Analysis
14 46 (8.10%) Line Management
15 42 (7.39%) Visualisation
16 39 (6.87%) Information Security
17 38 (6.69%) PRINCE2
18 37 (6.51%) Risk Management
19 35 (6.16%) Data-Driven Decision Making
Programming Languages
1 49 (8.63%) SQL
2 27 (4.75%) Java
2 27 (4.75%) Python
3 26 (4.58%) JavaScript
4 18 (3.17%) TypeScript
5 13 (2.29%) BrightScript
5 13 (2.29%) C#
5 13 (2.29%) Kotlin
5 13 (2.29%) Objective-C
6 10 (1.76%) PowerShell
7 4 (0.70%) PHP
7 4 (0.70%) R
8 3 (0.53%) ABAP
8 3 (0.53%) Bash
8 3 (0.53%) Data Analysis Expressions
8 3 (0.53%) Perl
8 3 (0.53%) Ruby
9 1 (0.18%) T-SQL
9 1 (0.18%) VB
9 1 (0.18%) VB.NET
Qualifications
1 76 (13.38%) Degree
2 67 (11.80%) Security Cleared
3 29 (5.11%) SC Cleared
4 22 (3.87%) DV Cleared
5 14 (2.46%) CISSP
5 14 (2.46%) Computer Science Degree
5 14 (2.46%) ITIL Certification
6 9 (1.58%) CISM
6 9 (1.58%) Master's Degree
7 8 (1.41%) PMI Certification
8 7 (1.23%) Six Sigma Green Belt
9 6 (1.06%) CRISC
10 4 (0.70%) DBS Check
10 4 (0.70%) PMP
11 2 (0.35%) APMP
11 2 (0.35%) AWS Certification
11 2 (0.35%) BPSS Clearance
11 2 (0.35%) Microsoft Certification
11 2 (0.35%) PhD
11 2 (0.35%) TOGAF Certification
Quality Assurance & Compliance
1 35 (6.16%) QA
2 31 (5.46%) ISO/IEC 27001
3 29 (5.11%) NIST
3 29 (5.11%) PMO
4 25 (4.40%) GRC
5 23 (4.05%) Actionable Recommendations
5 23 (4.05%) Data Quality
6 22 (3.87%) GDPR
7 10 (1.76%) SLA
8 8 (1.41%) JSP 440
9 7 (1.23%) NCSC
10 4 (0.70%) Accessibility
10 4 (0.70%) Cyber Essentials
10 4 (0.70%) Cyber Essentials PLUS
11 3 (0.53%) PCI DSS
11 3 (0.53%) SOC 2
12 2 (0.35%) ISO 22301
13 1 (0.18%) ISO 14001
13 1 (0.18%) ISO 9001
13 1 (0.18%) Sarbanes-Oxley
System Software
1 18 (3.17%) Active Directory
2 9 (1.58%) Docker
3 3 (0.53%) Hyper-V
3 3 (0.53%) VMware Infrastructure
4 1 (0.18%) Virtual Desktop
4 1 (0.18%) Virtual Machines
Systems Management
1 11 (1.94%) Kubernetes
1 11 (1.94%) SCCM
2 7 (1.23%) Terraform
3 5 (0.88%) Microsoft Intune
4 4 (0.70%) Ansible
5 2 (0.35%) Active Directory Federation Services
5 2 (0.35%) Single Sign-On
6 1 (0.18%) Autotask
6 1 (0.18%) Progress Chef
Vendors
1 65 (11.44%) Microsoft
2 25 (4.40%) SAP
3 13 (2.29%) Cisco
3 13 (2.29%) Oracle
4 10 (1.76%) Databricks
5 8 (1.41%) Workday
6 7 (1.23%) Salesforce
6 7 (1.23%) ServiceNow
6 7 (1.23%) VMware
7 6 (1.06%) Citrix
8 4 (0.70%) Avaya
8 4 (0.70%) Google
8 4 (0.70%) Infor
8 4 (0.70%) OpenAI
8 4 (0.70%) Talend
9 3 (0.53%) Sparx
10 2 (0.35%) GoldenSource
10 2 (0.35%) QinetiQ
10 2 (0.35%) Splunk
10 2 (0.35%) Zscaler