Content Management System (CMS)
UK

The following table provides summary statistics for permanent job vacancies with a requirement for CMS skills. Included is a benchmarking guide to the salaries offered in vacancies that have cited CMS over the 6 months to 10 December 2023 with a comparison to the same period in the previous 2 years.

6 months to
10 Dec 2023
Same period 2022 Same period 2021
Rank 413 351 229
Rank change year-on-year -62 -122 +22
Permanent jobs citing CMS 349 1,202 2,078
As % of all permanent jobs advertised in the UK 0.67% 0.98% 1.64%
As % of the Application Platforms category 6.69% 8.43% 13.12%
Number of salaries quoted 302 762 1,429
10th Percentile £33,050 £31,250 £31,250
25th Percentile £40,688 £37,500 £37,500
Median annual salary (50th Percentile) £55,000 £54,750 £50,000
Median % change year-on-year +0.46% +9.50% -
75th Percentile £67,500 £70,000 £65,000
90th Percentile £78,750 £90,000 £83,750
UK excluding London median annual salary £52,500 £47,500 £45,000
% change year-on-year +10.53% +5.56% +1.12%

All Application Platform Skills
UK

CMS is in the Application Platforms category. The following table is for comparison with the above and provides summary statistics for all permanent job vacancies with a requirement for application platform skills.

Permanent vacancies with a requirement for application platform skills 5,213 14,258 15,833
As % of all permanent jobs advertised in the UK 9.97% 11.67% 12.46%
Number of salaries quoted 3,883 8,496 10,303
10th Percentile £31,500 £31,250 £30,000
25th Percentile £40,500 £41,250 £37,750
Median annual salary (50th Percentile) £55,000 £57,500 £55,000
Median % change year-on-year -4.35% +4.55% +4.76%
75th Percentile £77,500 £78,750 £72,500
90th Percentile £95,000 £97,270 £90,000
UK excluding London median annual salary £49,944 £50,000 £45,369
% change year-on-year -0.11% +10.21% +0.82%

CMS
Job Vacancy Trend

Job postings citing CMS as a proportion of all IT jobs advertised.
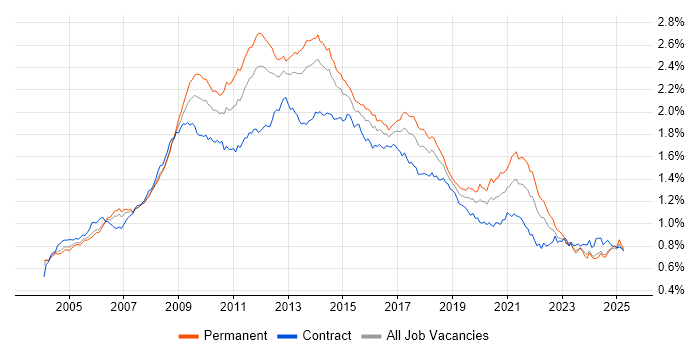
Job vacancy trend for CMS in the UK

CMS
Salary Trend

3-month moving average salary quoted in jobs citing CMS.

Salary trend for CMS in the UK

CMS
Salary Histogram

Salary distribution for jobs citing CMS over the 6 months to 10 December 2023.

Salary histogram for CMS in the UK

CMS
Top 17 Job Locations

The table below looks at the demand and provides a guide to the median salaries quoted in IT jobs citing CMS within the UK over the 6 months to 10 December 2023. The 'Rank Change' column provides an indication of the change in demand within each location based on the same 6 month period last year.

Location Rank Change
on Same Period
Last Year
Matching
Permanent
IT Job Ads
Median Salary
Past 6 Months
Median Salary
% Change
on Same Period
Last Year
Live
Jobs
England -66 306 £55,000 - 309
UK excluding London +28 201 £52,500 +10.53% 199
Work from Home 0 143 £55,000 +10.00% 156
London -36 132 £60,250 -7.31% 125
South East +85 58 £52,500 +1.45% 63
North of England +128 54 £50,000 - 72
South West 0 44 £52,500 +40.00% 16
North West +105 27 £55,000 +4.76% 36
Yorkshire +87 26 £50,000 +5.26% 26
Scotland +28 19 £50,000 +35.49% 8
Midlands +76 14 £55,000 +4.76% 22
West Midlands +91 11 £60,000 +14.29% 15
Northern Ireland +35 7 £42,000 -21.86% 3
East of England +64 5 £75,000 +36.36% 9
Wales +19 4 £52,500 +75.00% 12
East Midlands +32 3 £46,000 +10.63% 7
North East +39 1 £55,000 +14.58% 12

CMS
Co-occurring Skills and Capabilities by Category

The follow tables expand on the table above by listing co-occurrences grouped by category. The same employment type, locality and period is covered with up to 20 co-occurrences shown in each of the following categories:

Application Platforms
1 58 (16.62%) Umbraco
2 39 (11.17%) WordPress
3 38 (10.89%) Drupal
4 17 (4.87%) Kentico
4 17 (4.87%) Sitecore CMS
5 11 (3.15%) Headless CMS
5 11 (3.15%) Liferay
6 10 (2.87%) Adobe Experience Manager
7 9 (2.58%) IIS
7 9 (2.58%) SharePoint
8 7 (2.01%) EPiServer
9 6 (1.72%) Apache Solr
10 4 (1.15%) Confluence
11 3 (0.86%) DNN
12 1 (0.29%) Magnolia
12 1 (0.29%) NServiceBus
12 1 (0.29%) Sitefinity
Applications
1 15 (4.30%) Microsoft Office
2 10 (2.87%) Photoshop
3 7 (2.01%) Adobe Creative Suite
4 5 (1.43%) Adobe Illustrator
4 5 (1.43%) Microsoft Excel
4 5 (1.43%) Microsoft PowerPoint
5 4 (1.15%) InDesign
6 3 (0.86%) Acrobat
7 2 (0.57%) Adobe Premiere
7 2 (0.57%) Adobe XD
7 2 (0.57%) Spreadsheet
8 1 (0.29%) Adobe After Effects
8 1 (0.29%) Adobe Captivate
8 1 (0.29%) Chatbot
8 1 (0.29%) Sketch
Business Applications
1 11 (3.15%) Shopify
2 7 (2.01%) Magento
3 5 (1.43%) Dynamics CRM
4 4 (1.15%) Dynamics GP
5 3 (0.86%) SAP Hybris
5 3 (0.86%) SAP Oil and Gas
6 2 (0.57%) SDL Web 8
6 2 (0.57%) Workday HCM
7 1 (0.29%) Elite 3E
7 1 (0.29%) Remedy ITSM
7 1 (0.29%) Salesforce CRM
7 1 (0.29%) Workfront
Cloud Services
1 77 (22.06%) Azure
2 49 (14.04%) AWS
3 20 (5.73%) Azure DevOps
4 14 (4.01%) GitHub
4 14 (4.01%) Google Analytics
5 12 (3.44%) Microsoft 365
5 12 (3.44%) SaaS
6 10 (2.87%) Azure Service Bus
6 10 (2.87%) Power Platform
7 9 (2.58%) Serverless
8 7 (2.01%) Azure API Management
8 7 (2.01%) Cloudflare
9 6 (1.72%) Azure Cosmos DB
9 6 (1.72%) Azure Monitor
9 6 (1.72%) Azure Sentinel
9 6 (1.72%) MailChimp
10 5 (1.43%) AWS CloudFormation
10 5 (1.43%) GCP
10 5 (1.43%) PaaS
10 5 (1.43%) SAP Commerce Cloud
Communications & Networking
1 3 (0.86%) Internet
2 2 (0.57%) Firewall
2 2 (0.57%) Intranet
2 2 (0.57%) SAN
3 1 (0.29%) DNS
3 1 (0.29%) LAN
3 1 (0.29%) Remote Desktop
3 1 (0.29%) SMTP
3 1 (0.29%) VPN
3 1 (0.29%) WAN
3 1 (0.29%) Wireshark
Database & Business Intelligence
1 33 (9.46%) MySQL
2 25 (7.16%) SQL Server
3 9 (2.58%) MariaDB
3 9 (2.58%) MongoDB
3 9 (2.58%) Power BI
4 7 (2.01%) Elasticsearch
4 7 (2.01%) Metadata
4 7 (2.01%) NoSQL
4 7 (2.01%) PostgreSQL
5 6 (1.72%) Jackrabbit
5 6 (1.72%) Redis
6 5 (1.43%) Azure SQL Database
7 4 (1.15%) Data Lake
8 2 (0.57%) Mixpanel
8 2 (0.57%) Tableau
9 1 (0.29%) Amazon RDS
9 1 (0.29%) BigQuery
9 1 (0.29%) MarkLogic
9 1 (0.29%) Relational Database
9 1 (0.29%) SQL Server Integration Services
Development Applications
1 57 (16.33%) Git
2 13 (3.72%) Jenkins
2 13 (3.72%) JIRA
3 12 (3.44%) Visual Studio
4 10 (2.87%) webpack
5 6 (1.72%) TestRail
6 4 (1.15%) Octopus Deploy
7 3 (0.86%) SonarQube
7 3 (0.86%) Team Foundation Server
8 2 (0.57%) Dreamweaver
8 2 (0.57%) GitLab
8 2 (0.57%) gulp
8 2 (0.57%) Jasmine
8 2 (0.57%) Karma Test Runner
8 2 (0.57%) Selenium
8 2 (0.57%) TeamCity
9 1 (0.29%) CircleCI
9 1 (0.29%) SpecFlow
9 1 (0.29%) Storybook
9 1 (0.29%) Vite
General
1 78 (22.35%) Social Skills
2 62 (17.77%) Marketing
3 36 (10.32%) Finance
4 25 (7.16%) Analytical Skills
5 18 (5.16%) Retail
5 18 (5.16%) Tech for Good
6 14 (4.01%) Manufacturing
6 14 (4.01%) Public Sector
7 11 (3.15%) Publishing
8 8 (2.29%) Legal
8 8 (2.29%) Presentation Skills
9 5 (1.43%) Inclusion and Diversity
9 5 (1.43%) Law
9 5 (1.43%) Telecoms
10 4 (1.15%) Organisational Skills
11 3 (0.86%) Automotive
11 3 (0.86%) Banking
12 2 (0.57%) Advertising
12 2 (0.57%) Electronics
12 2 (0.57%) Health Technology
Job Titles
1 143 (40.97%) Developer
2 44 (12.61%) Senior
3 38 (10.89%) Architect
4 29 (8.31%) Senior Developer
5 26 (7.45%) .NET Developer
5 26 (7.45%) Web Developer
6 20 (5.73%) Analyst
7 19 (5.44%) Technical Architect
8 18 (5.16%) Full Stack Developer
9 17 (4.87%) Web Manager
10 16 (4.58%) Lead
10 16 (4.58%) PHP Developer
11 14 (4.01%) Project Manager
12 13 (3.72%) Drupal Developer
12 13 (3.72%) Software Engineer
13 12 (3.44%) C# Developer
13 12 (3.44%) Solutions Architect
14 11 (3.15%) Front-End Developer (Client-Side Developer)
14 11 (3.15%) Programme Manager
14 11 (3.15%) Umbraco Developer
Libraries, Frameworks & Software Standards
1 105 (30.09%) CSS
2 98 (28.08%) .NET
3 92 (26.36%) HTML
4 48 (13.75%) ASP.NET
5 45 (12.89%) .NET Core
6 41 (11.75%) React
7 27 (7.74%) jQuery
8 24 (6.88%) Laravel
8 24 (6.88%) Node.js
9 22 (6.30%) AngularJS
10 21 (6.02%) .NET Framework
10 21 (6.02%) RESTful
11 19 (5.44%) Web Services
12 18 (5.16%) HTML5
13 16 (4.58%) Next.js
13 16 (4.58%) Vue
14 14 (4.01%) Sass
15 13 (3.72%) Blazor
16 12 (3.44%) REST
17 11 (3.15%) CSS3
Miscellaneous
1 28 (8.02%) Product Ownership
2 17 (4.87%) Management Information System
3 13 (3.72%) Mobile App
4 11 (3.15%) Self-Motivation
5 10 (2.87%) Legacy Systems
6 9 (2.58%) Social Media
7 8 (2.29%) Cloud Native
7 8 (2.29%) Enterprise Software
7 8 (2.29%) Marketing Technology
8 6 (1.72%) Distributed Architecture
8 6 (1.72%) Virtual Team
9 5 (1.43%) CMDB
9 5 (1.43%) iPhone
9 5 (1.43%) Onboarding
9 5 (1.43%) Taxonomies
10 4 (1.15%) Data Protection Act
10 4 (1.15%) Data Structures
10 4 (1.15%) Distributed Systems
10 4 (1.15%) Graphic Design
10 4 (1.15%) Team-Oriented Environment
Operating Systems
1 16 (4.58%) Windows
2 9 (2.58%) Windows Server
3 5 (1.43%) Linux
4 4 (1.15%) Windows 10
5 3 (0.86%) Android
5 3 (0.86%) Apple iOS
5 3 (0.86%) Windows Server 2016
6 2 (0.57%) Windows Server 2012
7 1 (0.29%) VMS
Processes & Methodologies
1 109 (31.23%) Content Management
2 100 (28.65%) Agile
3 69 (19.77%) DevOps
4 67 (19.20%) Web Development
5 66 (18.91%) CRM
6 60 (17.19%) E-Commerce
7 55 (15.76%) Full Stack Development
8 54 (15.47%) User Experience
9 49 (14.04%) Project Management
10 44 (12.61%) MVC
11 42 (12.03%) SEO
12 38 (10.89%) Software Engineering
13 36 (10.32%) Scrum
14 31 (8.88%) Analytics
14 31 (8.88%) CI/CD
15 28 (8.02%) Roadmaps
16 27 (7.74%) ERP
16 27 (7.74%) Front End Development
17 25 (7.16%) Problem-Solving
18 23 (6.59%) Microservices
Programming Languages
1 111 (31.81%) JavaScript
2 81 (23.21%) C#
3 65 (18.62%) SQL
4 58 (16.62%) PHP
5 18 (5.16%) Python
6 15 (4.30%) Java
7 10 (2.87%) TypeScript
8 9 (2.58%) Bash
9 8 (2.29%) PowerShell
10 6 (1.72%) Kusto Query Language
10 6 (1.72%) T-SQL
11 1 (0.29%) C++
11 1 (0.29%) Go
11 1 (0.29%) XPath
11 1 (0.29%) XQuery
Qualifications
1 29 (8.31%) Degree
2 8 (2.29%) Master's Degree
3 7 (2.01%) Security Cleared
4 6 (1.72%) Computer Science Degree
4 6 (1.72%) SC Cleared
5 4 (1.15%) Azure Certification
6 2 (0.57%) DV Cleared
7 1 (0.29%) ITIL Certification
7 1 (0.29%) ITIL Foundation Certificate
7 1 (0.29%) PMI Certification
7 1 (0.29%) PMP
Quality Assurance & Compliance
1 26 (7.45%) QA
2 11 (3.15%) Accessibility
3 8 (2.29%) ISO/IEC 27001
4 6 (1.72%) ISO 9000
4 6 (1.72%) PCI DSS
5 5 (1.43%) GDPR
6 3 (0.86%) WCAG
7 2 (0.57%) Data Quality
7 2 (0.57%) PMO
System Software
1 27 (7.74%) Docker
2 9 (2.58%) Active Directory
3 2 (0.57%) Hyper-V
4 1 (0.29%) Virtual Servers
4 1 (0.29%) VMware ESXi
4 1 (0.29%) VMware Infrastructure
4 1 (0.29%) vSphere
Systems Management
1 21 (6.02%) Kubernetes
2 9 (2.58%) Terraform
3 3 (0.86%) SCCM
4 2 (0.57%) SCOM
5 1 (0.29%) cPanel
5 1 (0.29%) Microsoft Intune
5 1 (0.29%) vCenter Server
5 1 (0.29%) WSUS
Vendors
1 41 (11.75%) Microsoft
2 29 (8.31%) Adobe
3 20 (5.73%) Google
4 17 (4.87%) Sitecore
5 11 (3.15%) SAP
6 8 (2.29%) Salesforce
7 7 (2.01%) VMware
8 5 (1.43%) DocuSign
8 5 (1.43%) ServiceNow
8 5 (1.43%) Zoho
9 3 (0.86%) iManage
9 3 (0.86%) Intapp
9 3 (0.86%) Rollbar
10 2 (0.57%) Aderant
10 2 (0.57%) Dynatrace
10 2 (0.57%) HP
10 2 (0.57%) Optimizely
10 2 (0.57%) Riverbed
10 2 (0.57%) WooCommerce
10 2 (0.57%) Workday