Creative Thinking Jobs

Creative Thinking
UK

The table below provides summary statistics for permanent job vacancies requiring Creative Thinking skills. It includes a benchmarking guide to the annual salaries offered in vacancies that cited Creative Thinking over the 6 months leading up to 30 April 2025, comparing them to the same period in the previous two years.

6 months to
30 Apr 2025
Same period 2024 Same period 2023
Rank 177 297 297
Rank change year-on-year +120 0 +1
Permanent jobs citing Creative Thinking 900 948 1,231
As % of all permanent jobs advertised in the UK 1.73% 0.96% 1.18%
As % of the Processes & Methodologies category 1.85% 1.12% 1.24%
Number of salaries quoted 115 391 457
10th Percentile £38,250 £29,000 £36,250
25th Percentile £54,125 £37,283 £50,000
Median annual salary (50th Percentile) £67,500 £52,500 £65,000
Median % change year-on-year +28.57% -19.23% +4.00%
75th Percentile £90,625 £70,000 £87,500
90th Percentile £137,500 £97,500 £101,150
UK excluding London median annual salary £57,000 £42,920 £55,000
% change year-on-year +32.81% -21.96% -7.56%

All Process and Methodology Skills
UK

Creative Thinking falls under the Processes and Methodologies category. For comparison with the information above, the following table provides summary statistics for all permanent job vacancies requiring process or methodology skills.

Permanent vacancies with a requirement for process or methodology skills 48,641 84,574 99,457
As % of all permanent jobs advertised in the UK 93.26% 86.00% 95.63%
Number of salaries quoted 26,531 59,798 58,397
10th Percentile £30,580 £29,000 £34,000
25th Percentile £42,500 £40,000 £45,000
Median annual salary (50th Percentile) £57,500 £55,000 £61,500
Median % change year-on-year +4.55% -10.57% +2.50%
75th Percentile £76,250 £72,500 £82,500
90th Percentile £98,750 £92,500 £100,000
UK excluding London median annual salary £52,500 £50,000 £55,000
% change year-on-year +5.00% -9.09% +4.76%

Creative Thinking
Job Vacancy Trend

Job postings citing Creative Thinking as a proportion of all IT jobs advertised.
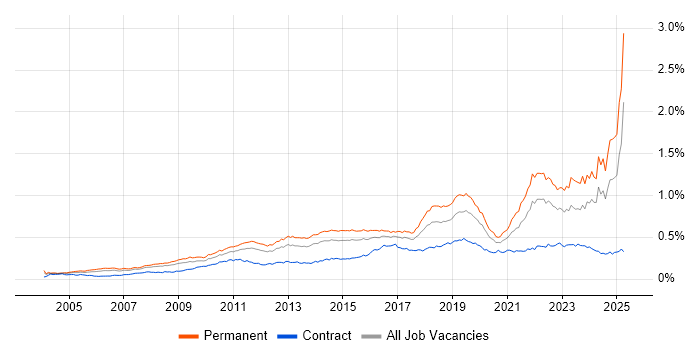
Job vacancy trend for Creative Thinking in the UK

Creative Thinking
Salary Trend

3-month moving average salary quoted in jobs citing Creative Thinking.

Salary trend for Creative Thinking in the UK

Creative Thinking
Salary Histogram

Salary distribution for jobs citing Creative Thinking over the 6 months to 30 April 2025.

Salary histogram for Creative Thinking in the UK

Creative Thinking
Top 16 Job Locations

The table below looks at the demand and provides a guide to the median salaries quoted in IT jobs citing Creative Thinking within the UK over the 6 months to 30 April 2025. The 'Rank Change' column provides an indication of the change in demand within each location based on the same 6 month period last year.

Location Rank Change
on Same Period
Last Year
Matching
Permanent
IT Job Ads
Median Salary
Past 6 Months
Median Salary
% Change
on Same Period
Last Year
Live
Jobs
England +121 838 £66,367 +32.73% 445
UK excluding London +171 651 £57,000 +32.81% 187
Work from Home +166 419 £65,000 +18.18% 217
London +21 247 £80,000 +45.45% 274
North of England +201 239 £50,890 +59.03% 57
North West +159 217 £50,890 +24.12% 40
South East +178 182 £60,500 +40.96% 41
Midlands +56 139 £57,000 +29.55% 33
West Midlands +48 112 £57,000 +11.22% 18
South West +51 32 £66,367 +56.16% 15
Scotland +92 29 £55,211 -7.98% 15
East Midlands +44 27 - - 15
East of England +40 27 £55,000 +37.50% 23
Yorkshire +57 19 £94,637 +36.17% 15
North East +48 3 £45,000 +63.64% 2
Northern Ireland +31 3 £90,000 +200.00% 2

Creative Thinking
Co-occurring Skills and Capabilities by Category

The follow tables expand on the table above by listing co-occurrences grouped by category. The same employment type, locality and period is covered with up to 20 co-occurrences shown in each of the following categories:

Application Platforms
1 32 (3.56%) SharePoint
2 24 (2.67%) CMS
3 7 (0.78%) WordPress
4 5 (0.56%) Confluence
5 2 (0.22%) Adobe Experience Manager
5 2 (0.22%) SAS
5 2 (0.22%) Umbraco
6 1 (0.11%) CICS
6 1 (0.11%) Drupal
6 1 (0.11%) Ethereum
6 1 (0.11%) Kentico
Applications
1 105 (11.67%) Microsoft Office
2 102 (11.33%) Microsoft Excel
3 20 (2.22%) Microsoft PowerPoint
4 8 (0.89%) Trello
5 7 (0.78%) Adobe Creative Suite
6 6 (0.67%) Adobe Illustrator
6 6 (0.67%) Adobe XD
6 6 (0.67%) Microsoft Project
6 6 (0.67%) Photoshop
7 4 (0.44%) MS Visio
8 3 (0.33%) Adobe After Effects
8 3 (0.33%) InDesign
8 3 (0.33%) UserZoom
9 2 (0.22%) Adobe Premiere
9 2 (0.22%) Sketch
10 1 (0.11%) Stata
Business Applications
1 20 (2.22%) Dynamics AX
2 13 (1.44%) Dynamics CRM
3 5 (0.56%) Relativity
4 4 (0.44%) Ringtail
4 4 (0.44%) Veritas eDiscovery
5 2 (0.22%) PeopleSoft Financials
6 1 (0.11%) Oracle EBS
6 1 (0.11%) Salesforce CRM
Cloud Services
1 93 (10.33%) Azure
2 46 (5.11%) AWS
3 34 (3.78%) PaaS
4 31 (3.44%) SaaS
5 26 (2.89%) Power Platform
6 25 (2.78%) Azure DevOps
7 24 (2.67%) Microsoft 365
8 21 (2.33%) Figma
9 18 (2.00%) Amazon EC2
9 18 (2.00%) Google Analytics
10 14 (1.56%) Cloud Computing
11 13 (1.44%) iPaaS
12 11 (1.22%) Dynamics 365
13 10 (1.11%) GCP
14 9 (1.00%) IBM Watson
14 9 (1.00%) Serverless
15 7 (0.78%) Azure Service Bus
15 7 (0.78%) Canva
16 6 (0.67%) Azure Logic Apps
16 6 (0.67%) ChatGPT
Communications & Networking
1 12 (1.33%) 5G
1 12 (1.33%) SD-WAN
1 12 (1.33%) WAN
2 8 (0.89%) Firewall
3 7 (0.78%) Intranet
3 7 (0.78%) VPN
4 5 (0.56%) Network Security
4 5 (0.56%) Software-Defined Radio
4 5 (0.56%) TCP/IP
4 5 (0.56%) Wireless
5 2 (0.22%) Bluetooth
5 2 (0.22%) DNS
5 2 (0.22%) Ethernet
5 2 (0.22%) FlexRay
5 2 (0.22%) Wi-Fi
6 1 (0.11%) Broadband
Database & Business Intelligence
1 21 (2.33%) PostgreSQL
2 19 (2.11%) SQL Server
3 18 (2.00%) Power BI
4 14 (1.56%) Data Lake
5 12 (1.33%) Relational Database
6 9 (1.00%) QlikView
7 8 (0.89%) MySQL
8 4 (0.44%) EDRMS
8 4 (0.44%) MongoDB
9 3 (0.33%) NoSQL
9 3 (0.33%) RDBMS
10 2 (0.22%) Azure SQL Database
10 2 (0.22%) Data Warehouse
10 2 (0.22%) Tableau
11 1 (0.11%) Big Data
11 1 (0.11%) Data Vault
11 1 (0.11%) DB2
11 1 (0.11%) GIS
11 1 (0.11%) Metadata
11 1 (0.11%) SQL Server Reporting Services
Development Applications
1 17 (1.89%) IntelliJ
2 13 (1.44%) JIRA
3 11 (1.22%) Git
4 5 (0.56%) Axure RP
5 4 (0.44%) Visual Studio
6 3 (0.33%) Balsamiq
7 2 (0.22%) Jenkins
8 1 (0.11%) Babel
8 1 (0.11%) Burp Suite
8 1 (0.11%) Cypress.io
8 1 (0.11%) GitLab
8 1 (0.11%) IBM UrbanCode
8 1 (0.11%) Metasploit
8 1 (0.11%) Moq
8 1 (0.11%) Postman
8 1 (0.11%) SoapUI
8 1 (0.11%) SpecFlow
8 1 (0.11%) webpack
General
1 346 (38.44%) Legal
2 306 (34.00%) Inclusion and Diversity
3 288 (32.00%) Law
4 285 (31.67%) Social Skills
5 282 (31.33%) Finance
6 173 (19.22%) Marketing
7 143 (15.89%) Analytical Skills
8 73 (8.11%) Retail
9 57 (6.33%) Telecoms
10 45 (5.00%) Organisational Skills
11 41 (4.56%) Advertising
11 41 (4.56%) Banking
12 33 (3.67%) Presentation Skills
13 24 (2.67%) Manufacturing
14 22 (2.44%) Influencing Skills
15 21 (2.33%) Games
16 19 (2.11%) Electronics
17 13 (1.44%) Public Sector
18 11 (1.22%) Multimedia
19 8 (0.89%) Public Speaking
Job Titles
1 151 (16.78%) Senior
2 66 (7.33%) Graduate
3 51 (5.67%) Risk Manager
4 44 (4.89%) Lead
5 42 (4.67%) Analyst
6 38 (4.22%) Account Manager
7 37 (4.11%) Technology Risk Manager
8 35 (3.89%) Audit Manager
8 35 (3.89%) Senior Manager
9 34 (3.78%) Strategic Account Manager
10 31 (3.44%) Architect
11 25 (2.78%) Designer
11 25 (2.78%) Senior Audit Manager
12 21 (2.33%) Product Owner
13 20 (2.22%) Developer
14 17 (1.89%) Java Engineer
15 16 (1.78%) Quality Manager
15 16 (1.78%) Senior Quality Manager
15 16 (1.78%) Senior Support Manager
15 16 (1.78%) Support Manager
Libraries, Frameworks & Software Standards
1 28 (3.11%) React
2 24 (2.67%) .NET
3 21 (2.33%) .NET Framework
4 20 (2.22%) HTML
5 19 (2.11%) REST
6 15 (1.67%) CSS
7 11 (1.22%) YAML
8 8 (0.89%) AngularJS
9 6 (0.67%) Node.js
10 5 (0.56%) .NET Core
10 5 (0.56%) Entity Framework
10 5 (0.56%) Middleware
11 4 (0.44%) RESTful
12 3 (0.33%) ASP.NET
12 3 (0.33%) HTML5
12 3 (0.33%) Spring
12 3 (0.33%) Spring MVC
13 2 (0.22%) Hibernate
13 2 (0.22%) JSON
13 2 (0.22%) XML
Miscellaneous
1 283 (31.44%) Cyberattack
2 71 (7.89%) Product Ownership
3 56 (6.22%) Robotics
4 53 (5.89%) Blockchain
5 51 (5.67%) Social Media
6 50 (5.56%) Management Information System
7 36 (4.00%) Digital Media
8 34 (3.78%) Marketing Technology
9 21 (2.33%) Greenfield Project
10 18 (2.00%) Security Posture
11 17 (1.89%) Self-Motivation
12 14 (1.56%) Blog
13 13 (1.44%) Onboarding
14 12 (1.33%) GNSS
14 12 (1.33%) Self-Driving Car
15 11 (1.22%) Analytical Mindset
16 10 (1.11%) Cloud Native
17 9 (1.00%) Data Structures
18 8 (0.89%) FPGA
18 8 (0.89%) VHDL
Operating Systems
1 41 (4.56%) Windows
2 22 (2.44%) Linux
3 14 (1.56%) Windows Vista
4 10 (1.11%) Apple iOS
5 5 (0.56%) Windows 10
6 4 (0.44%) Windows Server
7 3 (0.33%) Android
7 3 (0.33%) Mac OS
7 3 (0.33%) Unix
8 1 (0.11%) zOS
Processes & Methodologies
1 313 (34.78%) Cybersecurity
2 302 (33.56%) Line Management
3 295 (32.78%) Agile
4 261 (29.00%) Mentoring
5 217 (24.11%) Coaching
6 172 (19.11%) Analytics
7 166 (18.44%) Continuous Improvement
8 164 (18.22%) Problem-Solving
9 121 (13.44%) Customer Experience
10 120 (13.33%) Risk Management
11 111 (12.33%) Project Management
12 96 (10.67%) Strategic Thinking
13 94 (10.44%) Artificial Intelligence
14 93 (10.33%) Customer Service
15 91 (10.11%) Data Analytics
16 82 (9.11%) Data Analysis
17 80 (8.89%) Contingency Planning
18 70 (7.78%) Logistics
18 70 (7.78%) Performance Metrics
19 69 (7.67%) Project Delivery
Programming Languages
1 34 (3.78%) Python
2 32 (3.56%) SQL
3 25 (2.78%) JavaScript
4 23 (2.56%) Java
5 21 (2.33%) C#
6 18 (2.00%) PowerShell
7 16 (1.78%) R
8 14 (1.56%) C++
9 12 (1.33%) C
9 12 (1.33%) Perl
10 9 (1.00%) MATLAB
11 8 (0.89%) Tcl
11 8 (0.89%) VB
12 5 (0.56%) Bash
12 5 (0.56%) Bicep
13 2 (0.22%) Apex Code
13 2 (0.22%) Delphi
13 2 (0.22%) PHP
14 1 (0.11%) ActionScript 2.0
14 1 (0.11%) JCL
Qualifications
1 161 (17.89%) Degree
2 48 (5.33%) CISA
3 33 (3.67%) CISSP
3 33 (3.67%) Master's Degree
4 20 (2.22%) ISACA
5 18 (2.00%) ACCA
5 18 (2.00%) DBS Check
6 17 (1.89%) CCAB
6 17 (1.89%) CIMA
6 17 (1.89%) CIPFA
6 17 (1.89%) Computer Science Degree
6 17 (1.89%) ICAEW
7 16 (1.78%) CISM
7 16 (1.78%) CRISC
8 15 (1.67%) PhD
9 9 (1.00%) Microsoft Certification
10 7 (0.78%) PMI Certification
10 7 (0.78%) PMP
10 7 (0.78%) Security Cleared
11 6 (0.67%) SC Cleared
Quality Assurance & Compliance
1 297 (33.00%) NCSC
2 59 (6.56%) ITGC
3 44 (4.89%) ISO/IEC 27001
4 22 (2.44%) Accessibility
5 21 (2.33%) Sarbanes-Oxley
6 20 (2.22%) GDPR
7 17 (1.89%) SOC 2
8 15 (1.67%) NIST
8 15 (1.67%) PMO
9 9 (1.00%) Data Quality
9 9 (1.00%) QA
10 7 (0.78%) COBIT
11 3 (0.33%) WCAG
12 2 (0.22%) California Consumer Privacy Act
12 2 (0.22%) Cyber Essentials
12 2 (0.22%) Cyber Essentials PLUS
12 2 (0.22%) JTAG
12 2 (0.22%) PCI DSS
13 1 (0.11%) Actionable Recommendations
System Software
1 21 (2.33%) Docker
2 11 (1.22%) Active Directory
3 8 (0.89%) Embedded Firmware
3 8 (0.89%) Firmware
4 6 (0.67%) Virtual Desktop
4 6 (0.67%) Virtual Machines
Systems Management
1 21 (2.33%) Kubernetes
2 6 (0.67%) Microsoft Intune
3 5 (0.56%) Ansible
3 5 (0.56%) CASB
3 5 (0.56%) Nagios
3 5 (0.56%) SCCM
4 4 (0.44%) Graylog
4 4 (0.44%) Opsgenie
5 2 (0.22%) MIIS
6 1 (0.11%) CA Service Virtualization
6 1 (0.11%) Grafana
6 1 (0.11%) Nessus
6 1 (0.11%) Progress Chef
6 1 (0.11%) Prometheus
6 1 (0.11%) Puppet
6 1 (0.11%) RSA Archer
6 1 (0.11%) Single Sign-On
Vendors
1 105 (11.67%) Microsoft
2 25 (2.78%) Google
3 22 (2.44%) Oracle
3 22 (2.44%) SAP
4 21 (2.33%) Adobe
5 14 (1.56%) IBM
6 13 (1.44%) Databricks
6 13 (1.44%) Xilinx
7 12 (1.33%) ServiceNow
8 8 (0.89%) Altera
8 8 (0.89%) Green Hills
8 8 (0.89%) Twitter
9 7 (0.78%) Salesforce
9 7 (0.78%) YouTube
10 6 (0.67%) Apple
10 6 (0.67%) Citrix
10 6 (0.67%) Workday
11 5 (0.56%) Instagram
11 5 (0.56%) Sophos
12 4 (0.44%) Palo Alto