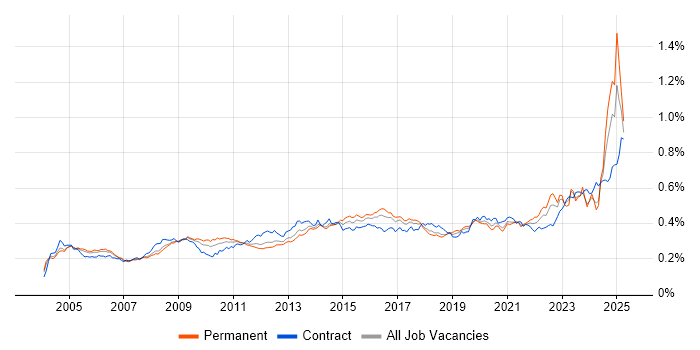
Risk Assessment Job Trends

Risk Assessment
UK

The table below provides summary statistics and salary benchmarking for jobs requiring Risk Assessment skills. It covers vacancies from the 6 months leading up to 18 September 2025, with comparisons to the same periods in the previous two years.

6 months to
18 Sep 2025
Same period 2024 Same period 2023
Rank 390 454 497
Rank change year-on-year +64 +43 +114
Permanent jobs citing Risk Assessment 313 382 291
As % of all permanent jobs advertised in the UK 0.63% 0.49% 0.48%
As % of the Processes & Methodologies category 0.71% 0.60% 0.51%
Number of salaries quoted 176 199 209
10th Percentile £39,500 £44,700 £47,354
25th Percentile £51,000 £50,000 £55,000
Median annual salary (50th Percentile) £60,000 £55,000 £70,000
Median % change year-on-year +9.09% -21.43% +16.83%
75th Percentile £87,500 £76,250 £85,000
90th Percentile £107,500 £90,000 £105,000
UK excluding London median annual salary £55,000 £55,000 £62,500
% change year-on-year - -12.00% +13.64%

All Process and Methodology Skills
UK

Risk Assessment falls under the Processes and Methodologies category. For comparison with the information above, the following table provides summary statistics for all permanent job vacancies requiring process or methodology skills.

Permanent vacancies with a requirement for process or methodology skills 43,869 63,416 56,859
As % of all permanent jobs advertised in the UK 88.70% 81.19% 94.35%
Number of salaries quoted 24,728 36,039 42,828
10th Percentile £28,500 £32,000 £32,750
25th Percentile £36,250 £42,500 £45,000
Median annual salary (50th Percentile) £55,000 £57,500 £60,000
Median % change year-on-year -4.35% -4.17% -
75th Percentile £75,000 £77,500 £80,000
90th Percentile £96,250 £95,000 £100,000
UK excluding London median annual salary £47,500 £52,500 £54,000
% change year-on-year -9.52% -2.78% +2.86%

Risk Assessment
Job Vacancy Trend

Job postings citing Risk Assessment as a proportion of all IT jobs advertised.

Job vacancy trend for Risk Assessment in the UK

Risk Assessment
Salary Trend

Salary distribution trend for jobs in the UK citing Risk Assessment.

Salary distribution trend for jobs in the UK citing Risk Assessment

Risk Assessment
Salary Histogram

Salary distribution for jobs citing Risk Assessment over the 6 months to 18 September 2025.

Salary histogram for Risk Assessment in the UK

Risk Assessment
Top 17 Job Locations

The table below looks at the demand and provides a guide to the median salaries quoted in IT jobs citing Risk Assessment within the UK over the 6 months to 18 September 2025. The 'Rank Change' column provides an indication of the change in demand within each location based on the same 6 month period last year.

Location Rank Change
on Same Period
Last Year
Matching
Permanent
IT Job Ads
Median Salary
Past 6 Months
Median Salary
% Change
on Same Period
Last Year
Live
Jobs
England +23 271 £60,000 +9.09% 175
UK excluding London +69 196 £55,000 - 135
Work from Home +77 108 £69,384 +20.67% 82
London +44 103 £86,250 +32.69% 77
South East +52 59 £55,000 +10.00% 48
Midlands +61 47 £55,000 -8.33% 28
North of England +4 38 £69,384 +20.67% 19
West Midlands +60 37 £55,000 -21.43% 21
North West 0 31 £62,192 +8.16% 11
South West +44 14 £56,250 -16.67% 17
Scotland +52 12 £56,298 - 6
Northern Ireland +23 11 £52,000 - 2
East Midlands +29 9 £37,500 -30.56% 7
East of England -44 9 £51,000 +13.33% 10
Wales - 6 £67,192 - 7
North East - 5 £75,574 - 3
Yorkshire +13 2 £57,500 -10.85% 6

Risk Assessment
Co-occurring Skills and Capabilities by Category

The follow tables expand on the table above by listing co-occurrences grouped by category. The same employment type, locality and period is covered with up to 20 co-occurrences shown in each of the following categories:

Application Platforms
1 4 (1.28%) Confluence
2 3 (0.96%) SharePoint
3 2 (0.64%) TPMS
Applications
1 14 (4.47%) Microsoft Excel
2 13 (4.15%) Microsoft Office
2 13 (4.15%) Microsoft PowerPoint
3 6 (1.92%) AutoCAD
3 6 (1.92%) Civil 3D
4 3 (0.96%) Microsoft Project
5 2 (0.64%) MS Visio
Business Applications
1 4 (1.28%) Adaptiv
1 4 (1.28%) Q-Pulse
2 3 (0.96%) Fidessa
3 1 (0.32%) C-CURE
3 1 (0.32%) Oracle Applications
3 1 (0.32%) Oracle EBS
Cloud Services
1 27 (8.63%) Azure
2 15 (4.79%) Entra ID
3 14 (4.47%) AWS
4 13 (4.15%) Microsoft 365
4 13 (4.15%) SaaS
5 5 (1.60%) GCP
5 5 (1.60%) Power Platform
6 3 (0.96%) Serverless
7 2 (0.64%) Amazon S3
7 2 (0.64%) AWS Lambda
7 2 (0.64%) Azure DevOps
7 2 (0.64%) Azure Sentinel
7 2 (0.64%) Microsoft Copilot
7 2 (0.64%) OCI
7 2 (0.64%) Snowflake
8 1 (0.32%) Amazon GuardDuty
8 1 (0.32%) AWS CloudFormation
8 1 (0.32%) Azure API Management
8 1 (0.32%) Azure Data Factory
8 1 (0.32%) Azure Monitor
Communications & Networking
1 28 (8.95%) Modbus
2 24 (7.67%) Ethernet
3 17 (5.43%) Network Security
4 13 (4.15%) MQTT
5 12 (3.83%) Profibus
6 7 (2.24%) Firewall
7 5 (1.60%) Wireless
8 4 (1.28%) Internet
8 4 (1.28%) Intrusion Detection
9 3 (0.96%) FIX Connectivity
9 3 (0.96%) Multicast
9 3 (0.96%) VPN
10 1 (0.32%) AMQP
10 1 (0.32%) DNS
10 1 (0.32%) HTTP
10 1 (0.32%) IPv4
10 1 (0.32%) IPv6
10 1 (0.32%) SSL
10 1 (0.32%) TCP/IP
Database & Business Intelligence
1 9 (2.88%) Tableau
2 5 (1.60%) Power BI
2 5 (1.60%) SQL Server
3 2 (0.64%) MongoDB
3 2 (0.64%) PostgreSQL
4 1 (0.32%) Azure SQL Database
4 1 (0.32%) Big Data
4 1 (0.32%) Data Lake
4 1 (0.32%) Data Warehouse
4 1 (0.32%) Geospatial Data
4 1 (0.32%) Hadoop
4 1 (0.32%) Looker
4 1 (0.32%) Metadata
4 1 (0.32%) NoSQL
4 1 (0.32%) Oracle Database
4 1 (0.32%) Oracle Exadata
4 1 (0.32%) Oracle Reports
Development Applications
1 8 (2.56%) JIRA
2 4 (1.28%) Git
3 1 (0.32%) Artifactory
3 1 (0.32%) Burp Suite
3 1 (0.32%) ER Studio
3 1 (0.32%) ERwin
3 1 (0.32%) Metasploit
3 1 (0.32%) Postman
3 1 (0.32%) PowerDesigner
3 1 (0.32%) Rational DOORS
3 1 (0.32%) REST Assured
3 1 (0.32%) Snyk
3 1 (0.32%) SoapUI
General
1 144 (46.01%) Social Skills
2 89 (28.43%) Finance
3 63 (20.13%) Legal
4 38 (12.14%) Analytical Skills
5 37 (11.82%) Manufacturing
6 30 (9.58%) Banking
7 29 (9.27%) Inclusion and Diversity
8 27 (8.63%) Public Sector
9 20 (6.39%) Retail
10 17 (5.43%) Influencing Skills
10 17 (5.43%) Organisational Skills
10 17 (5.43%) Pharmaceutical
11 16 (5.11%) Electronics
12 15 (4.79%) Local Government
13 14 (4.47%) Law
14 10 (3.19%) Presentation Skills
15 8 (2.56%) Aviation
16 7 (2.24%) Aerospace
16 7 (2.24%) Retail Banking
17 5 (1.60%) Telecoms
Job Titles
1 55 (17.57%) Analyst
2 42 (13.42%) Senior
3 41 (13.10%) Risk Manager
4 29 (9.27%) Lead
5 28 (8.95%) Architect
6 26 (8.31%) Security Architect
7 24 (7.67%) Systems Engineer
8 20 (6.39%) Risk Analyst
9 17 (5.43%) Civil Engineer
9 17 (5.43%) Infrastructure Engineer
10 15 (4.79%) Security Analyst
11 14 (4.47%) Development Engineer
12 12 (3.83%) Control Systems Engineer
13 11 (3.51%) Automation Engineer
13 11 (3.51%) Business Analyst
13 11 (3.51%) Consultant
13 11 (3.51%) Security Specialist
14 10 (3.19%) Principal Architect
15 9 (2.88%) Senior Analyst
16 8 (2.56%) Operations Manager
Libraries, Frameworks & Software Standards
1 9 (2.88%) .NET
2 6 (1.92%) CSS
3 4 (1.28%) EDI
4 3 (0.96%) FIX Protocol
4 3 (0.96%) Pandas
5 2 (0.64%) Node-RED
5 2 (0.64%) OAuth
5 2 (0.64%) OAuth2
6 1 (0.32%) Hugging Face
6 1 (0.32%) JWT
6 1 (0.32%) Middleware
6 1 (0.32%) Oracle Fusion
6 1 (0.32%) Oracle GoldenGate
6 1 (0.32%) Playwright
6 1 (0.32%) PyTorch
6 1 (0.32%) REST
6 1 (0.32%) TensorFlow
Miscellaneous
1 48 (15.34%) Management Information System
2 36 (11.50%) Security Posture
3 30 (9.58%) SCADA
4 20 (6.39%) NHS
5 17 (5.43%) Operational Technology
6 16 (5.11%) Renewable Energy
7 15 (4.79%) Biopharmaceutical
7 15 (4.79%) Data Centre
8 14 (4.47%) IoT
9 13 (4.15%) Industry 4.0
10 12 (3.83%) Taxonomies
11 11 (3.51%) Product Ownership
12 10 (3.19%) Onboarding
12 10 (3.19%) Reinsurance
13 9 (2.88%) Market Risk
14 7 (2.24%) Self-Motivation
15 6 (1.92%) Credit Risk
15 6 (1.92%) Driving Licence
16 5 (1.60%) Embedded Systems
16 5 (1.60%) Foreign Exchange (FX)
Operating Systems
1 13 (4.15%) Windows
2 6 (1.92%) Linux
3 1 (0.32%) Mac OS
3 1 (0.32%) Unix
3 1 (0.32%) VMS
3 1 (0.32%) Windows Server
Processes & Methodologies
1 152 (48.56%) Risk Management
2 104 (33.23%) Cybersecurity
3 95 (30.35%) Information Security
4 84 (26.84%) Continuous Improvement
5 72 (23.00%) Mentoring
6 63 (20.13%) Stakeholder Management
7 56 (17.89%) Agile
8 47 (15.02%) Problem-Solving
9 44 (14.06%) Project Delivery
10 42 (13.42%) Project Management
11 38 (12.14%) Regulatory Compliance
12 37 (11.82%) Decision-Making
13 33 (10.54%) Due Diligence
14 31 (9.90%) Stakeholder Engagement
15 29 (9.27%) Incident Response
15 29 (9.27%) Information Assurance
16 28 (8.95%) Risk Register
17 27 (8.63%) Computer Science
18 25 (7.99%) Security Management
18 25 (7.99%) Validation
Programming Languages
1 17 (5.43%) Ladder Logic
1 17 (5.43%) Python
2 11 (3.51%) SQL
3 10 (3.19%) C#
4 6 (1.92%) JavaScript
5 5 (1.60%) Java
6 4 (1.28%) C++
7 3 (0.96%) R
8 1 (0.32%) Bash
8 1 (0.32%) Kotlin
8 1 (0.32%) PL/SQL
8 1 (0.32%) PowerShell
8 1 (0.32%) Rust
Qualifications
1 95 (30.35%) Degree
2 56 (17.89%) CISM
3 55 (17.57%) CISSP
4 40 (12.78%) CRISC
5 34 (10.86%) Security Cleared
6 33 (10.54%) Master's Degree
7 28 (8.95%) SC Cleared
8 21 (6.71%) HNC
9 18 (5.75%) CISA
9 18 (5.75%) HND
10 17 (5.43%) Chartered Engineer
11 16 (5.11%) Computer Science Degree
12 14 (4.47%) PMI Certification
13 13 (4.15%) ISO 27001 Lead Auditor
14 10 (3.19%) CFA
14 10 (3.19%) PMP
14 10 (3.19%) Postgraduate
15 9 (2.88%) BPSS Clearance
15 9 (2.88%) CompTIA Security+
15 9 (2.88%) DBS Check
Quality Assurance & Compliance
1 92 (29.39%) ISO/IEC 27001
2 74 (23.64%) NIST
3 30 (9.58%) SOC 2
4 29 (9.27%) GRC
5 17 (5.43%) Accessibility
6 16 (5.11%) NCSC
7 15 (4.79%) GDPR
7 15 (4.79%) NIST 800
8 13 (4.15%) QA
9 12 (3.83%) PMO
9 12 (3.83%) SOC 1
10 11 (3.51%) Sarbanes-Oxley
11 10 (3.19%) Cyber Essentials
12 7 (2.24%) PCI DSS
13 6 (1.92%) Data Quality
14 5 (1.60%) COBIT
14 5 (1.60%) ISO 22301
14 5 (1.60%) ISO 31000
14 5 (1.60%) JSP 440
15 4 (1.28%) P3O
System Software
1 11 (3.51%) VMware ESXi
1 11 (3.51%) VMware Infrastructure
2 7 (2.24%) Active Directory
3 1 (0.32%) Docker
3 1 (0.32%) Virtual Machines
Systems Management
1 15 (4.79%) Functional Safety
2 12 (3.83%) RSA Archer
3 3 (0.96%) Microsoft Intune
4 2 (0.64%) BMC PATROL
4 2 (0.64%) CASB
5 1 (0.32%) Ansible
5 1 (0.32%) Kubernetes
5 1 (0.32%) Nessus
5 1 (0.32%) Oracle RMAN
5 1 (0.32%) Terraform
Vendors
1 36 (11.50%) Microsoft
2 32 (10.22%) Siemens
3 25 (7.99%) Rockwell
4 14 (4.47%) Allen-Bradley
5 13 (4.15%) AVEVA
6 11 (3.51%) VMware
7 10 (3.19%) Murex
8 6 (1.92%) Oracle
9 4 (1.28%) Adobe
9 4 (1.28%) FIS
9 4 (1.28%) Qualys
9 4 (1.28%) ServiceNow
10 3 (0.96%) Atlassian
10 3 (0.96%) Bloomberg
10 3 (0.96%) CQG
10 3 (0.96%) ION Trading
10 3 (0.96%) Patsystems
10 3 (0.96%) Reuters
10 3 (0.96%) Salesforce
10 3 (0.96%) Trayport