Reverse Engineering Jobs with Work from Home Options

Reverse Engineering
UK > Work from Home

The table below provides summary statistics for permanent job vacancies with an option to work from home (WFH) and a requirement for Reverse Engineering skills. Included is a benchmarking guide to the salaries offered in vacancies that have cited Reverse Engineering over the 6 months to 12 May 2024 with a comparison to the same period in the previous 2 years.

6 months to
12 May 2024
Same period 2023 Same period 2022
Rank 549 580 659
Rank change year-on-year +31 +79 -128
Permanent jobs citing Reverse Engineering 28 83 182
As % of all permanent jobs with a WFH option 0.083% 0.20% 0.26%
As % of the Processes & Methodologies category 0.091% 0.21% 0.27%
Number of salaries quoted 14 54 104
10th Percentile £57,875 £57,375 £38,625
25th Percentile £61,250 £63,750 £52,500
Median annual salary (50th Percentile) £65,000 £72,500 £75,000
Median % change year-on-year -10.34% -3.33% +20.00%
75th Percentile £99,688 £75,000 £100,000
90th Percentile £105,000 £77,500 -
UK median annual salary £75,000 £70,000 £78,750
% change year-on-year +7.14% -11.11% +12.50%

All Process and Methodology Skills
Work from Home

Reverse Engineering is in the Processes and Methodologies category. The following table is for comparison with the above and provides summary statistics for all permanent job vacancies with a WFH option and a requirement for process or methodology skills.

Permanent vacancies with a requirement for process or methodology skills 30,887 39,758 66,711
As % of all permanent jobs with a WFH option 91.37% 96.08% 97.00%
Number of salaries quoted 23,439 27,659 41,086
10th Percentile £33,750 £37,500 £36,250
25th Percentile £42,500 £47,500 £45,750
Median annual salary (50th Percentile) £57,500 £62,500 £60,000
Median % change year-on-year -8.00% +4.17% +9.09%
75th Percentile £75,000 £82,500 £80,000
90th Percentile £95,000 £100,000 £95,000
UK median annual salary £55,000 £61,000 £60,000
% change year-on-year -9.84% +1.67% +9.09%

Reverse Engineering
Trend for Jobs with a WFH Option

Job vacancies with a work from home option citing Reverse Engineering as a proportion of all IT jobs advertised.
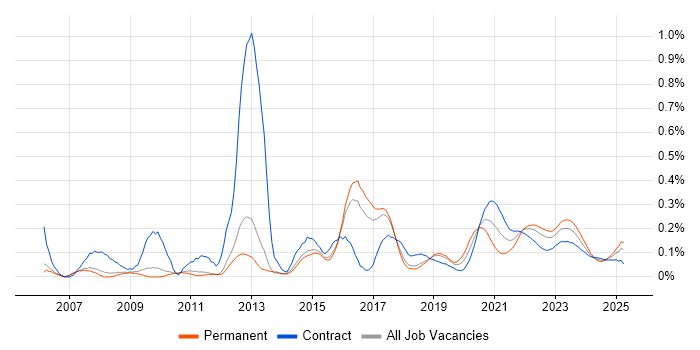
Reverse Engineering trend for jobs with a WFH option

Reverse Engineering
Salary Trend for Jobs with a WFH Option

3-month moving average salary quoted in job vacancies with a work from home option citing Reverse Engineering.

Reverse Engineering salary trend for jobs with a WFH option

Reverse Engineering
Salary Histogram for Jobs with a WFH Option

Salary distribution for jobs with a work from home option citing Reverse Engineering over the 6 months to 12 May 2024.

Reverse Engineering salary histogram for jobs with a WFH option

Reverse Engineering
Co-occurring Skills and Capabilities with WFH Options by Category

The follow tables expand on the table above by listing co-occurrences grouped by category. The same employment type, locality and period is covered with up to 20 co-occurrences shown in each of the following categories:

Application Platforms
1 1 (3.57%) Microsoft Exchange
1 1 (3.57%) SAS
Cloud Services
1 8 (28.57%) SaaS
2 6 (21.43%) Azure
3 4 (14.29%) AWS
3 4 (14.29%) GCP
4 1 (3.57%) Microsoft 365
Communications & Networking
1 8 (28.57%) Firewall
2 7 (25.00%) DNS
3 3 (10.71%) BGP
3 3 (10.71%) DMZ
3 3 (10.71%) Intrusion Detection
3 3 (10.71%) IPsec
3 3 (10.71%) MPLS
3 3 (10.71%) Network Security
3 3 (10.71%) OSPF
3 3 (10.71%) SD-WAN
3 3 (10.71%) SSL
3 3 (10.71%) VPN
4 2 (7.14%) Internet
4 2 (7.14%) TCP/IP
4 2 (7.14%) Wireless
4 2 (7.14%) Wireless Security
Database & Business Intelligence
1 2 (7.14%) Metadata
2 1 (3.57%) Data Warehouse
2 1 (3.57%) SAS EBI
Development Applications
1 4 (14.29%) Jenkins
2 2 (7.14%) Burp Suite
2 2 (7.14%) Metasploit
3 1 (3.57%) Eclipse
3 1 (3.57%) Git
3 1 (3.57%) JIRA
3 1 (3.57%) Subversion
3 1 (3.57%) Visual Studio
General
1 6 (21.43%) Finance
2 5 (17.86%) Social Skills
3 2 (7.14%) Presentation Skills
4 1 (3.57%) Analytical Skills
4 1 (3.57%) Billing
4 1 (3.57%) Inclusion and Diversity
4 1 (3.57%) Legal
4 1 (3.57%) Local Government
Job Titles
1 10 (35.71%) Software Engineer
2 9 (32.14%) Senior
3 8 (28.57%) Principal Engineer
3 8 (28.57%) Principal Software Engineer
3 8 (28.57%) Senior Software Engineer
3 8 (28.57%) Senior Windows Engineer
3 8 (28.57%) Windows Engineer
4 4 (14.29%) Analyst
4 4 (14.29%) Threat and Vulnerability Manager
4 4 (14.29%) Vulnerability Manager
5 3 (10.71%) Firewall Engineer
5 3 (10.71%) Network Engineer
5 3 (10.71%) Presales Engineer
5 3 (10.71%) Presales Network Engineer
6 2 (7.14%) Applications Engineer
6 2 (7.14%) Architect
6 2 (7.14%) C# Software Engineer
6 2 (7.14%) Data Architect
6 2 (7.14%) Penetration Tester
6 2 (7.14%) Tester
Libraries, Frameworks & Software Standards
1 2 (7.14%) .NET
1 2 (7.14%) .NET Core
1 2 (7.14%) .NET Framework
1 2 (7.14%) REST
2 1 (3.57%) POSIX
Miscellaneous
1 8 (28.57%) Cloud Native
1 8 (28.57%) Virtual Team
2 7 (25.00%) PKI
3 2 (7.14%) Algorithms
3 2 (7.14%) Cyber Kill Chain
3 2 (7.14%) Embedded Systems
3 2 (7.14%) Mobile App
3 2 (7.14%) Security Posture
4 1 (3.57%) Cyber Defence
4 1 (3.57%) Cyberattack
4 1 (3.57%) IoT
4 1 (3.57%) Management Information System
4 1 (3.57%) Reference Data
4 1 (3.57%) Taxonomies
Operating Systems
1 17 (60.71%) Windows
2 11 (39.29%) Linux
3 8 (28.57%) Mac OS
4 3 (10.71%) Unix
5 2 (7.14%) Kali Linux
5 2 (7.14%) Mac OS X
6 1 (3.57%) Android
6 1 (3.57%) Apple iOS
6 1 (3.57%) FreeBSD
6 1 (3.57%) Red Hat Enterprise Linux
Processes & Methodologies
1 17 (60.71%) Cybersecurity
2 13 (46.43%) Cyber Threat Intelligence
2 13 (46.43%) Threat Intelligence
3 11 (39.29%) Software Engineering
4 10 (35.71%) Threat Detection
5 9 (32.14%) Agile
5 9 (32.14%) TDD
5 9 (32.14%) Threat Analysis
6 8 (28.57%) Analytics
6 8 (28.57%) Component Testing
6 8 (28.57%) Computer Security
6 8 (28.57%) Data Science
6 8 (28.57%) Kalman Filter
6 8 (28.57%) Multithreading
6 8 (28.57%) Performance Optimisation
6 8 (28.57%) Security Analytics
6 8 (28.57%) Technical Leadership
6 8 (28.57%) Test Automation
7 6 (21.43%) Data Modelling
7 6 (21.43%) Penetration Testing
Programming Languages
1 8 (28.57%) Python
2 5 (17.86%) C#
3 4 (14.29%) SQL
4 2 (7.14%) Bash
4 2 (7.14%) C
4 2 (7.14%) C++
4 2 (7.14%) Perl
5 1 (3.57%) Java
5 1 (3.57%) JavaScript
5 1 (3.57%) PL/SQL
5 1 (3.57%) PowerShell
5 1 (3.57%) ProC
5 1 (3.57%) Shell Script
Qualifications
1 4 (14.29%) CISM
1 4 (14.29%) CISSP
1 4 (14.29%) CRISC
1 4 (14.29%) Degree
1 4 (14.29%) GIAC
1 4 (14.29%) ISSMP
2 2 (7.14%) CHECK Team Member
2 2 (7.14%) CREST Certified
2 2 (7.14%) Network+ Certification
2 2 (7.14%) OSCP
2 2 (7.14%) Security Cleared
3 1 (3.57%) DV Cleared
3 1 (3.57%) SC Cleared
3 1 (3.57%) TOGAF Certification
Quality Assurance & Compliance
1 4 (14.29%) COBIT
2 2 (7.14%) PCI DSS
3 1 (3.57%) California Consumer Privacy Act
3 1 (3.57%) Data Quality
3 1 (3.57%) GDPR
3 1 (3.57%) HIPAA
3 1 (3.57%) ISO/IEC 27001
3 1 (3.57%) NIST
3 1 (3.57%) SLA
3 1 (3.57%) SOC 2
System Software
1 1 (3.57%) Active Directory
1 1 (3.57%) Firmware
Systems Management
1 4 (14.29%) Ansible
2 2 (7.14%) Nmap
Vendors
1 8 (28.57%) Dell
2 5 (17.86%) Microsoft
3 4 (14.29%) Alibaba
4 3 (10.71%) Fortinet
5 2 (7.14%) LogRhythm
5 2 (7.14%) McAfee
5 2 (7.14%) Oracle