Unit Testing Jobs with Hybrid/Remote/WFH Options

Unit Testing
UK > Work from Home

The table below provides summary statistics for permanent remote or hybrid work requiring Unit Testing skills. It includes a benchmarking guide to the annual salaries offered in vacancies that cited Unit Testing over the 6 months leading up to 1 May 2025, comparing them to the same period in the previous two years.

6 months to
1 May 2025
Same period 2024 Same period 2023
Rank 159 167 159
Rank change year-on-year +8 -8 -30
Permanent jobs citing Unit Testing 294 659 952
As % of all permanent jobs with a WFH option 1.97% 1.95% 2.23%
As % of the Processes & Methodologies category 2.11% 2.12% 2.32%
Number of salaries quoted 249 418 687
10th Percentile £46,250 £41,250 £45,000
25th Percentile £52,500 £47,500 £51,250
Median annual salary (50th Percentile) £60,000 £60,000 £60,000
75th Percentile £71,250 £65,000 £75,000
90th Percentile £89,756 £75,375 £89,852
UK median annual salary £60,000 £57,500 £60,000
% change year-on-year +4.35% -4.17% -

All Process and Methodology Skills
Work from Home

Unit Testing falls under the Processes and Methodologies category. For comparison with the information above, the following table provides summary statistics for all permanent job vacancies with remote or hybrid options requiring process or methodology skills.

Permanent vacancies with a requirement for process or methodology skills 13,930 31,014 41,082
As % of all permanent jobs with a WFH option 93.15% 91.65% 96.09%
Number of salaries quoted 9,709 23,583 28,561
10th Percentile £30,000 £33,930 £37,500
25th Percentile £45,000 £42,500 £47,500
Median annual salary (50th Percentile) £60,000 £57,500 £62,500
Median % change year-on-year +4.35% -8.00% +4.17%
75th Percentile £77,500 £75,000 £82,500
90th Percentile £102,500 £95,000 £100,000
UK median annual salary £57,500 £55,000 £61,500
% change year-on-year +4.55% -10.57% +2.50%

Unit Testing
Trend for Jobs with a WFH Option

Job vacancies with remote working options citing Unit Testing as a proportion of all IT jobs advertised.
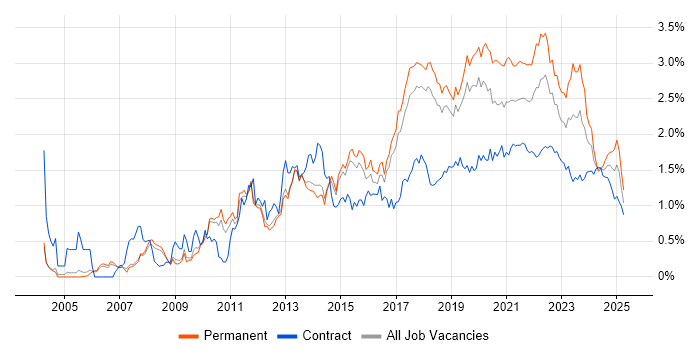
Unit Testing trend for jobs with Hybrid/Remote/WFH options

Unit Testing
Salary Trend for Jobs with a WFH Option

3-month moving average salary quoted in job vacancies with remote working options citing Unit Testing.

Unit Testing salary trend for jobs with a WFH option

Unit Testing
Salary Histogram for Jobs with a WFH Option

Salary distribution for jobs with remote working options citing Unit Testing over the 6 months to 1 May 2025.

Unit Testing salary histogram for jobs with a WFH option

Unit Testing
Co-occurring Skills and Capabilities with WFH Options by Category

The follow tables expand on the table above by listing co-occurrences grouped by category. The same employment type, locality and period is covered with up to 20 co-occurrences shown in each of the following categories:

Application Platforms
1 6 (2.04%) Confluence
2 4 (1.36%) Apache Spark
2 4 (1.36%) JBoss
3 3 (1.02%) OpenEdge
4 2 (0.68%) IIS
4 2 (0.68%) Microsoft Exchange
5 1 (0.34%) Mule
5 1 (0.34%) SharePoint
Applications
1 1 (0.34%) Simulink
Business Applications
1 12 (4.08%) Oracle EBS
2 2 (0.68%) Dynamics CRM
3 1 (0.34%) Magento
Cloud Services
1 124 (42.18%) Azure
2 99 (33.67%) AWS
3 51 (17.35%) Azure DevOps
4 46 (15.65%) Serverless
5 40 (13.61%) AWS Lambda
6 39 (13.27%) SaaS
7 26 (8.84%) GitHub
8 22 (7.48%) Power Platform
9 17 (5.78%) GCP
10 16 (5.44%) Dynamics 365
11 14 (4.76%) PowerApps
12 8 (2.72%) Azure Logic Apps
13 6 (2.04%) GitHub Actions
14 5 (1.70%) Amazon EKS
15 4 (1.36%) Amazon EC2
15 4 (1.36%) Amazon S3
16 3 (1.02%) Apigee
16 3 (1.02%) Azure Cosmos DB
16 3 (1.02%) Datadog
17 2 (0.68%) Amazon ECS
Communications & Networking
1 8 (2.72%) Bluetooth
1 8 (2.72%) HTTP
1 8 (2.72%) Internet
2 7 (2.38%) Modbus
2 7 (2.38%) Profibus
2 7 (2.38%) RS-232
2 7 (2.38%) RS-485
2 7 (2.38%) Wireless
2 7 (2.38%) ZigBee
3 1 (0.34%) Broadband
3 1 (0.34%) Ethernet
Database & Business Intelligence
1 40 (13.61%) NoSQL
2 36 (12.24%) DynamoDB
3 29 (9.86%) SQL Server
4 19 (6.46%) PostgreSQL
5 12 (4.08%) MongoDB
6 11 (3.74%) MySQL
7 8 (2.72%) SQL Server Integration Services
7 8 (2.72%) SQL Server Reporting Services
8 7 (2.38%) Data Warehouse
8 7 (2.38%) Elasticsearch
8 7 (2.38%) Relational Database
9 6 (2.04%) Oracle Database
10 5 (1.70%) Big Data
10 5 (1.70%) Power BI
10 5 (1.70%) Redis
11 4 (1.36%) Biml
11 4 (1.36%) SQL Server Analysis Services
12 2 (0.68%) Azure SQL Database
13 1 (0.34%) Amazon RDS
13 1 (0.34%) Spatial Data
Development Applications
1 70 (23.81%) Git
2 39 (13.27%) JUnit
3 28 (9.52%) Mockito
4 23 (7.82%) Jasmine
4 23 (7.82%) Jenkins
5 22 (7.48%) Eclipse
5 22 (7.48%) IntelliJ
5 22 (7.48%) Karma Test Runner
5 22 (7.48%) Protractor
6 17 (5.78%) JIRA
6 17 (5.78%) Maven
7 14 (4.76%) NUnit
8 13 (4.42%) Visual Studio
9 12 (4.08%) GitLab
10 6 (2.04%) Gradle
11 5 (1.70%) Octopus Deploy
11 5 (1.70%) Postman
11 5 (1.70%) SonarQube
12 4 (1.36%) Mocha
12 4 (1.36%) Rational DOORS
General
1 67 (22.79%) Social Skills
2 38 (12.93%) Finance
3 34 (11.56%) Games
4 30 (10.20%) Banking
5 28 (9.52%) Inclusion and Diversity
6 19 (6.46%) Electronics
7 16 (5.44%) Analytical Skills
8 13 (4.42%) Public Sector
9 12 (4.08%) Tech for Good
10 10 (3.40%) Manufacturing
11 8 (2.72%) Aerospace
12 7 (2.38%) iGaming
12 7 (2.38%) Organisational Skills
13 5 (1.70%) Documentation Skills
13 5 (1.70%) Legal
13 5 (1.70%) Retail
14 4 (1.36%) Automotive
14 4 (1.36%) Investment Banking
14 4 (1.36%) Marketing
14 4 (1.36%) Telecoms
Job Titles
1 153 (52.04%) Developer
2 114 (38.78%) Senior
3 61 (20.75%) Senior Developer
4 59 (20.07%) Software Engineer
5 35 (11.90%) Java Developer
6 34 (11.56%) Lead
6 34 (11.56%) Software Developer
7 31 (10.54%) Senior Software Engineer
8 27 (9.18%) Senior Software Developer
9 26 (8.84%) Backend Developer
10 21 (7.14%) C# Developer
11 19 (6.46%) SaaS Developer
12 16 (5.44%) Full-Stack Developer
13 14 (4.76%) .NET Developer
13 14 (4.76%) Application Development Manager
13 14 (4.76%) Applications Development Manager
13 14 (4.76%) Applications Manager
13 14 (4.76%) Development Manager
14 13 (4.42%) React Developer
15 11 (3.74%) PHP Software Engineer
Libraries, Frameworks & Software Standards
1 104 (35.37%) React
2 96 (32.65%) .NET
3 61 (20.75%) Node.js
4 58 (19.73%) AngularJS
5 42 (14.29%) RESTful
6 37 (12.59%) GraphQL
7 36 (12.24%) RabbitMQ
8 35 (11.90%) .NET Core
8 35 (11.90%) REST
9 31 (10.54%) HTML
10 28 (9.52%) Hibernate
10 28 (9.52%) Kafka
11 25 (8.50%) JSON
12 24 (8.16%) CSS
12 24 (8.16%) JPA
13 21 (7.14%) .NET Framework
14 18 (6.12%) Spring
15 17 (5.78%) Jest
16 15 (5.10%) HTML5
17 11 (3.74%) Spring Boot
Miscellaneous
1 27 (9.18%) Algorithms
2 20 (6.80%) Management Information System
3 19 (6.46%) Mobile App
4 13 (4.42%) Legacy Systems
4 13 (4.42%) Mobile Games
5 12 (4.08%) Product Ownership
6 11 (3.74%) Virtual Team
7 10 (3.40%) Cloud Native
8 8 (2.72%) Embedded Systems
8 8 (2.72%) Greenfield Project
8 8 (2.72%) Online Banking
9 7 (2.38%) Enterprise Software
10 6 (2.04%) Distributed Systems
11 5 (1.70%) Robotics
12 3 (1.02%) Distributed Architecture
12 3 (1.02%) Self-Motivation
13 2 (0.68%) PDA
13 2 (0.68%) Public Cloud
14 1 (0.34%) Data Centre
14 1 (0.34%) Driving Licence
Operating Systems
1 34 (11.56%) Linux
2 23 (7.82%) Android
3 13 (4.42%) Windows
4 12 (4.08%) Apple iOS
5 7 (2.38%) FreeRTOS
6 5 (1.70%) Robot Operating System
7 2 (0.68%) Unix
Processes & Methodologies
1 161 (54.76%) Agile
2 128 (43.54%) Microservices
3 117 (39.80%) Software Engineering
4 99 (33.67%) DevOps
5 92 (31.29%) CI/CD
6 89 (30.27%) Test Automation
7 83 (28.23%) Mentoring
8 81 (27.55%) TDD
9 74 (25.17%) Clean Code
10 49 (16.67%) Full-Stack Development
10 49 (16.67%) Problem-Solving
11 46 (15.65%) SOLID
12 42 (14.29%) Line Management
13 41 (13.95%) Containerisation
14 40 (13.61%) Continuous Integration
14 40 (13.61%) Event-Driven
14 40 (13.61%) OO
14 40 (13.61%) Secure Coding
15 38 (12.93%) Coaching
15 38 (12.93%) Event-Driven Architecture
Programming Languages
1 89 (30.27%) C#
2 82 (27.89%) SQL
3 74 (25.17%) Java
4 63 (21.43%) JavaScript
5 60 (20.41%) TypeScript
6 33 (11.22%) C++
7 24 (8.16%) Python
8 22 (7.48%) C
8 22 (7.48%) PHP
9 11 (3.74%) Kotlin
10 10 (3.40%) Ruby
11 5 (1.70%) Bash
11 5 (1.70%) Groovy
11 5 (1.70%) Shell Script
11 5 (1.70%) T-SQL
12 4 (1.36%) PL/SQL
13 3 (1.02%) Go
13 3 (1.02%) OpenEdge ABL
13 3 (1.02%) Perl
13 3 (1.02%) Progress 4GL
Qualifications
1 51 (17.35%) Degree
2 16 (5.44%) Computer Science Degree
2 16 (5.44%) Security Cleared
3 11 (3.74%) SC Cleared
4 8 (2.72%) AWS Certification
5 6 (2.04%) AWS Certified Solutions Architect
5 6 (2.04%) Master's Degree
6 5 (1.70%) DBS Check
7 3 (1.02%) BPSS Clearance
8 2 (0.68%) Azure Certification
8 2 (0.68%) DV Cleared
8 2 (0.68%) Microsoft Certification
9 1 (0.34%) ISTQB
Quality Assurance & Compliance
1 40 (13.61%) QA
2 16 (5.44%) Accessibility
3 7 (2.38%) Data Quality
4 2 (0.68%) ISO/IEC 27001
4 2 (0.68%) SLA
5 1 (0.34%) AUTOSAR
5 1 (0.34%) IEC 62304
5 1 (0.34%) ISO 13485
5 1 (0.34%) ISO 26262
5 1 (0.34%) MISRA
5 1 (0.34%) MISRA C
5 1 (0.34%) NCSC
System Software
1 53 (18.03%) Docker
2 9 (3.06%) Firmware
3 8 (2.72%) Embedded Firmware
4 2 (0.68%) Active Directory
Systems Management
1 31 (10.54%) Kubernetes
2 18 (6.12%) Terraform
3 6 (2.04%) Argo
3 6 (2.04%) Prometheus
4 5 (1.70%) Ansible
5 3 (1.02%) Packer
6 1 (0.34%) CloudHub
6 1 (0.34%) Kibana
Vendors
1 29 (9.86%) IBM
2 26 (8.84%) Oracle
3 16 (5.44%) Microsoft
4 9 (3.06%) Xamarin
5 8 (2.72%) Okta
6 7 (2.38%) Google
7 6 (2.04%) New Relic
8 4 (1.36%) Databricks
8 4 (1.36%) F5
9 3 (1.02%) AppDynamics
9 3 (1.02%) Atlassian
9 3 (1.02%) Informatica
9 3 (1.02%) Progress
9 3 (1.02%) SAP
10 2 (0.68%) Aderant
10 2 (0.68%) Apple
10 2 (0.68%) Intapp
10 2 (0.68%) Splunk
10 2 (0.68%) Sun
10 2 (0.68%) Trayport