Visual Studio Jobs with Work from Home Options

Microsoft Visual Studio
UK > Work from Home

The table below provides summary statistics for permanent job vacancies with an option to work from home (WFH) and a requirement for Visual Studio skills. Included is a benchmarking guide to the salaries offered in vacancies that have cited Visual Studio over the 6 months to 27 April 2024 with a comparison to the same period in the previous 2 years.

6 months to
27 Apr 2024
Same period 2023 Same period 2022
Rank 312 354 359
Rank change year-on-year +42 +5 -136
Permanent jobs citing Visual Studio 321 377 634
As % of all permanent jobs with a WFH option 0.95% 0.87% 0.95%
As % of the Development Applications category 8.20% 5.64% 4.02%
Number of salaries quoted 285 278 453
10th Percentile £37,500 £41,250 £33,750
25th Percentile £43,750 £47,500 £42,500
Median annual salary (50th Percentile) £52,500 £57,000 £52,500
Median % change year-on-year -7.89% +8.57% +10.53%
75th Percentile £70,000 £71,250 £66,250
90th Percentile £80,000 £85,000 £75,000
UK median annual salary £50,000 £55,000 £54,000
% change year-on-year -9.09% +1.85% +13.68%

All Development Application Skills
Work from Home

Visual Studio is in the Development Applications category. The following table is for comparison with the above and provides summary statistics for all permanent job vacancies with a WFH option and a requirement for development application skills.

Permanent vacancies with a requirement for development application skills 3,915 6,679 15,762
As % of all permanent jobs with a WFH option 11.60% 15.48% 23.61%
Number of salaries quoted 3,030 4,728 8,311
10th Percentile £37,500 £41,250 £37,500
25th Percentile £46,250 £50,000 £45,000
Median annual salary (50th Percentile) £60,000 £64,305 £60,000
Median % change year-on-year -6.69% +7.18% +9.09%
75th Percentile £75,772 £80,000 £77,500
90th Percentile £91,934 £95,000 £91,250
UK median annual salary £60,000 £65,000 £62,500
% change year-on-year -7.69% +4.00% +9.65%

Visual Studio
Trend for Jobs with a WFH Option

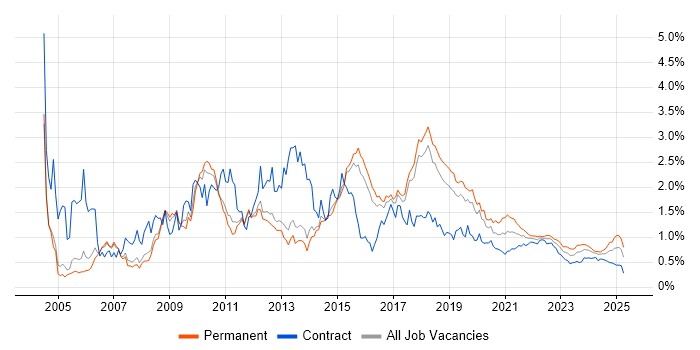
Job vacancies with a work from home option citing Visual Studio as a proportion of all IT jobs advertised.

Visual Studio trend for jobs with a WFH option

Visual Studio
Salary Trend for Jobs with a WFH Option

3-month moving average salary quoted in job vacancies with a work from home option citing Visual Studio.

Visual Studio salary trend for jobs with a WFH option

Visual Studio
Salary Histogram for Jobs with a WFH Option

Salary distribution for jobs with a work from home option citing Visual Studio over the 6 months to 27 April 2024.

Visual Studio salary histogram for jobs with a WFH option

Visual Studio
Co-occurring Skills and Capabilities with WFH Options by Category

The follow tables expand on the table above by listing co-occurrences grouped by category. The same employment type, locality and period is covered with up to 20 co-occurrences shown in each of the following categories:

Application Platforms
1 27 (8.41%) SharePoint
2 24 (7.48%) IIS
3 16 (4.98%) CMS
4 4 (1.25%) EPiServer
4 4 (1.25%) Umbraco
5 2 (0.62%) Confluence
6 1 (0.31%) BizTalk Server
6 1 (0.31%) IBM Notes
6 1 (0.31%) NServiceBus
Applications
1 21 (6.54%) Microsoft Office
2 4 (1.25%) Microsoft Excel
3 2 (0.62%) Adobe Illustrator
3 2 (0.62%) Photoshop
4 1 (0.31%) Adobe XD
4 1 (0.31%) MS Visio
4 1 (0.31%) Sketch
Business Applications
1 18 (5.61%) Dynamics CRM
2 16 (4.98%) Payment Gateway
3 4 (1.25%) Elite 3E
4 1 (0.31%) Dynamics NAV
4 1 (0.31%) Sage 200
4 1 (0.31%) Sage 50
4 1 (0.31%) Scribe Insight
4 1 (0.31%) Shopify
Cloud Services
1 166 (51.71%) Azure
2 99 (30.84%) Azure DevOps
3 39 (12.15%) Power Platform
4 35 (10.90%) GitHub
5 27 (8.41%) AWS
6 22 (6.85%) Dynamics 365
7 10 (3.12%) SaaS
8 9 (2.80%) Google Analytics
9 7 (2.18%) Figma
9 7 (2.18%) Pulumi
10 6 (1.87%) Azure Data Factory
10 6 (1.87%) PaaS
10 6 (1.87%) Serverless
11 5 (1.56%) Azure Synapse Analytics
11 5 (1.56%) Cloud Computing
12 3 (0.93%) Azure Functions
12 3 (0.93%) Azure Key Vault
12 3 (0.93%) Azure Monitor
12 3 (0.93%) Azure Service Bus
12 3 (0.93%) Azure Storage
Communications & Networking
1 13 (4.05%) Modbus
1 13 (4.05%) TCP/IP
2 9 (2.80%) CTI
3 7 (2.18%) Network Security
4 5 (1.56%) Internet
5 4 (1.25%) 5G
5 4 (1.25%) SD-WAN
5 4 (1.25%) WAN
6 2 (0.62%) Ethernet
6 2 (0.62%) RS-232
7 1 (0.31%) Intranet
7 1 (0.31%) Wireshark
Database & Business Intelligence
1 109 (33.96%) SQL Server
2 22 (6.85%) Data Warehouse
3 20 (6.23%) SQL Server Reporting Services
4 19 (5.92%) Power BI
5 14 (4.36%) MongoDB
5 14 (4.36%) SQL Server Integration Services
6 8 (2.49%) Relational Database
7 7 (2.18%) BusinessObjects
7 7 (2.18%) BusinessObjects Web Intelligence
7 7 (2.18%) Data Lake
7 7 (2.18%) Oracle Reports
7 7 (2.18%) PostgreSQL
7 7 (2.18%) Semantic Layer
7 7 (2.18%) SQLite
8 6 (1.87%) NoSQL
9 5 (1.56%) MySQL
10 4 (1.25%) Redis
11 2 (0.62%) Electronic Patient Records
11 2 (0.62%) MS Access
11 2 (0.62%) SQL Server Analysis Services
Development Applications
1 63 (19.63%) Git
2 42 (13.08%) Team Foundation Server
3 39 (12.15%) Visual Studio Code
4 22 (6.85%) Postman
5 21 (6.54%) NUnit
5 21 (6.54%) Selenium
6 19 (5.92%) JIRA
7 15 (4.67%) SoapUI
8 13 (4.05%) GitLab
9 12 (3.74%) TeamCity
10 11 (3.43%) Eclipse
11 10 (3.12%) SQL Server Management Studio (SSMS)
12 8 (2.49%) Subversion
13 7 (2.18%) Jasmine
14 6 (1.87%) JMeter
14 6 (1.87%) SpecFlow
15 5 (1.56%) Android Studio
15 5 (1.56%) Cypress.io
16 3 (0.93%) Moq
17 2 (0.62%) WebDriver
General
1 75 (23.36%) Finance
2 60 (18.69%) Social Skills
3 31 (9.66%) Manufacturing
4 26 (8.10%) Analytical Skills
4 26 (8.10%) Retail
5 23 (7.17%) Marketing
6 22 (6.85%) Public Sector
7 18 (5.61%) Electronics
8 16 (4.98%) Telecoms
9 14 (4.36%) Legal
10 13 (4.05%) Inclusion and Diversity
10 13 (4.05%) Law
11 12 (3.74%) Publishing
12 11 (3.43%) Police
13 10 (3.12%) Automotive
14 7 (2.18%) Local Government
15 5 (1.56%) Military
15 5 (1.56%) Organisational Skills
16 4 (1.25%) Aerospace
17 2 (0.62%) Pharmaceutical
Job Titles
1 187 (58.26%) Developer
2 114 (35.51%) .NET Developer
3 61 (19.00%) C# Developer
4 54 (16.82%) C# .NET Developer
5 47 (14.64%) Senior
5 47 (14.64%) Software Developer
6 44 (13.71%) Lead
7 38 (11.84%) Architect
8 35 (10.90%) Applications Developer
8 35 (10.90%) Software Engineer
9 26 (8.10%) .NET Applications Developer
10 24 (7.48%) C# Application Developer
11 23 (7.17%) Full Stack Developer
12 20 (6.23%) .NET Software Developer
12 20 (6.23%) Full-Stack C# Developer
12 20 (6.23%) Senior Software Engineer
13 19 (5.92%) Lead Developer
14 17 (5.30%) Full Stack .NET Developer
14 17 (5.30%) Lead .NET Developer
14 17 (5.30%) Senior Developer
Libraries, Frameworks & Software Standards
1 227 (70.72%) .NET
2 112 (34.89%) HTML
3 109 (33.96%) .NET Framework
4 84 (26.17%) CSS
5 73 (22.74%) ASP.NET
6 53 (16.51%) AngularJS
7 49 (15.26%) HTML5
8 42 (13.08%) .NET Core
9 39 (12.15%) XML
10 38 (11.84%) Web Services
10 38 (11.84%) WPF
11 37 (11.53%) SOAP
12 34 (10.59%) REST
12 34 (10.59%) RESTful
13 32 (9.97%) Blazor
14 31 (9.66%) JSON
15 28 (8.72%) jQuery
15 28 (8.72%) React
16 27 (8.41%) WinForms
17 24 (7.48%) WCF
Miscellaneous
1 26 (8.10%) Greenfield Project
2 18 (5.61%) FMCG
3 12 (3.74%) Product Ownership
4 10 (3.12%) Enterprise Software
5 8 (2.49%) Management Information System
6 7 (2.18%) Mobile App
7 6 (1.87%) Data Structures
7 6 (1.87%) Distributed Applications
7 6 (1.87%) Low-Code
8 5 (1.56%) Algorithms
9 4 (1.25%) GNSS
10 3 (0.93%) Hackathon
10 3 (0.93%) W3C
11 2 (0.62%) Data Centre
11 2 (0.62%) Driving Licence
11 2 (0.62%) Legacy Applications
11 2 (0.62%) NHS
11 2 (0.62%) Tandem
12 1 (0.31%) Analytical Mindset
12 1 (0.31%) Legacy Systems
Operating Systems
1 49 (15.26%) Windows
2 18 (5.61%) Linux
3 10 (3.12%) Android
4 3 (0.93%) Apple iOS
5 1 (0.31%) FreeBSD
5 1 (0.31%) Mac OS X
5 1 (0.31%) Ubuntu
Processes & Methodologies
1 148 (46.11%) Agile
2 116 (36.14%) DevOps
3 91 (28.35%) Software Engineering
4 76 (23.68%) MVC
5 52 (16.20%) Continuous Integration
6 51 (15.89%) CI/CD
7 48 (14.95%) Web Development
8 47 (14.64%) Scrum
9 44 (13.71%) Test Automation
10 43 (13.40%) TDD
11 42 (13.08%) Problem-Solving
12 41 (12.77%) Unit Testing
13 39 (12.15%) Business Intelligence
14 33 (10.28%) OO
15 32 (9.97%) Multithreading
16 31 (9.66%) Microservices
17 28 (8.72%) Design Patterns
17 28 (8.72%) Full Stack Development
18 27 (8.41%) User Stories
19 26 (8.10%) Analytics
Programming Languages
1 241 (75.08%) C#
2 126 (39.25%) SQL
3 120 (37.38%) JavaScript
4 42 (13.08%) Java
5 40 (12.46%) T-SQL
6 38 (11.84%) C++
7 22 (6.85%) Python
8 20 (6.23%) C
8 20 (6.23%) TypeScript
9 19 (5.92%) VB.NET
9 19 (5.92%) XPath
10 11 (3.43%) Bash
11 10 (3.12%) PHP
12 7 (2.18%) Bicep
12 7 (2.18%) PL/SQL
12 7 (2.18%) PowerShell
13 5 (1.56%) Perl
14 2 (0.62%) Embedded C
14 2 (0.62%) Embedded C++
14 2 (0.62%) VB
Qualifications
1 51 (15.89%) Degree
2 21 (6.54%) Computer Science Degree
3 18 (5.61%) Security Cleared
4 6 (1.87%) HNC
5 4 (1.25%) BPSS Clearance
6 2 (0.62%) Azure Certification
6 2 (0.62%) DBS Check
6 2 (0.62%) SC Cleared
Quality Assurance & Compliance
1 49 (15.26%) QA
2 21 (6.54%) Accessibility
3 7 (2.18%) Data Quality
4 4 (1.25%) PMO
4 4 (1.25%) WCAG
5 2 (0.62%) HL7
5 2 (0.62%) ISO/IEC 27001
System Software
1 11 (3.43%) Docker
2 5 (1.56%) Firmware
3 3 (0.93%) Active Directory
4 2 (0.62%) Embedded Firmware
Systems Management
1 10 (3.12%) Kubernetes
2 7 (2.18%) MIIS
2 7 (2.18%) Terraform
3 2 (0.62%) Functional Safety
Vendors
1 121 (37.69%) Microsoft
2 16 (4.98%) SAP
3 9 (2.80%) Google
4 7 (2.18%) Oracle
5 6 (1.87%) Facebook
5 6 (1.87%) MuleSoft
5 6 (1.87%) OutSystems
6 4 (1.25%) Aderant
6 4 (1.25%) Xamarin
7 3 (0.93%) Adobe
7 3 (0.93%) DevExpress
8 2 (0.62%) Cerner
8 2 (0.62%) Epicor
9 1 (0.31%) Lotus
9 1 (0.31%) Sage