Data Governance Jobs with Work from Home Options

Data Governance
UK > Work from Home

The table below provides summary statistics for permanent job vacancies with an option to work from home (WFH) and a requirement for Data Governance skills. Included is a benchmarking guide to the salaries offered in vacancies that have cited Data Governance over the 6 months to 4 May 2024 with a comparison to the same period in the previous 2 years.

6 months to
4 May 2024
Same period 2023 Same period 2022
Rank 238 206 405
Rank change year-on-year -32 +199 -21
Permanent jobs citing Data Governance 452 726 546
As % of all permanent jobs with a WFH option 1.34% 1.71% 0.80%
As % of the Processes & Methodologies category 1.46% 1.78% 0.83%
Number of salaries quoted 375 505 345
10th Percentile £41,250 £46,570 £41,750
25th Percentile £52,500 £47,500 £51,250
Median annual salary (50th Percentile) £70,000 £63,500 £67,500
Median % change year-on-year +10.24% -5.93% -
75th Percentile £85,000 £85,000 £85,000
90th Percentile £103,750 £97,243 £99,000
UK median annual salary £70,000 £65,000 £62,500
% change year-on-year +7.69% +4.00% +4.17%

All Process and Methodology Skills
Work from Home

Data Governance is in the Processes and Methodologies category. The following table is for comparison with the above and provides summary statistics for all permanent job vacancies with a WFH option and a requirement for process or methodology skills.

Permanent vacancies with a requirement for process or methodology skills 30,939 40,754 65,870
As % of all permanent jobs with a WFH option 91.60% 96.10% 96.90%
Number of salaries quoted 23,489 28,301 41,422
10th Percentile £33,750 £37,500 £36,250
25th Percentile £42,500 £47,500 £45,500
Median annual salary (50th Percentile) £57,500 £62,500 £60,000
Median % change year-on-year -8.00% +4.17% +9.09%
75th Percentile £75,000 £82,500 £80,000
90th Percentile £95,000 £100,000 £95,000
UK median annual salary £55,000 £61,500 £60,000
% change year-on-year -10.57% +2.50% +9.09%

Data Governance
Trend for Jobs with a WFH Option

Job vacancies with a work from home option citing Data Governance as a proportion of all IT jobs advertised.
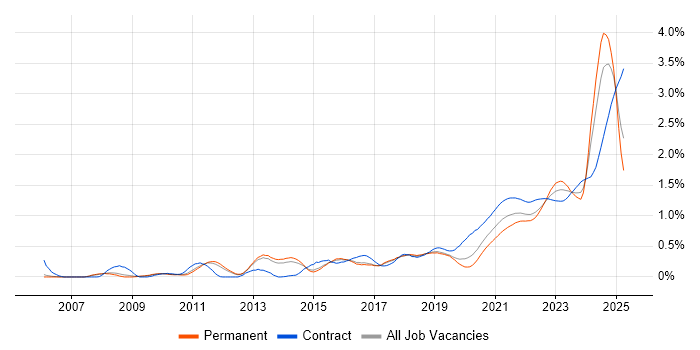
Data Governance trend for jobs with a WFH option

Data Governance
Salary Trend for Jobs with a WFH Option

3-month moving average salary quoted in job vacancies with a work from home option citing Data Governance.

Data Governance salary trend for jobs with a WFH option

Data Governance
Salary Histogram for Jobs with a WFH Option

Salary distribution for jobs with a work from home option citing Data Governance over the 6 months to 4 May 2024.

Data Governance salary histogram for jobs with a WFH option

Data Governance
Co-occurring Skills and Capabilities with WFH Options by Category

The follow tables expand on the table above by listing co-occurrences grouped by category. The same employment type, locality and period is covered with up to 20 co-occurrences shown in each of the following categories:

Application Platforms
1 18 (3.98%) Apache Spark
2 13 (2.88%) Apache Airflow
3 12 (2.65%) Confluence
4 10 (2.21%) Apache
5 9 (1.99%) WordPress
6 7 (1.55%) SAS
6 7 (1.55%) SharePoint
7 1 (0.22%) ArcGIS
7 1 (0.22%) CMS
Applications
1 16 (3.54%) Microsoft Excel
2 2 (0.44%) Microsoft Office
2 2 (0.44%) Microsoft PowerPoint
2 2 (0.44%) Spreadsheet
3 1 (0.22%) Adobe Captivate
Business Applications
1 4 (0.88%) SAP S/4HANA
2 1 (0.22%) Aladdin
2 1 (0.22%) Markit EDM
2 1 (0.22%) NetSuite
2 1 (0.22%) Salesforce CRM
2 1 (0.22%) SAP MDG
2 1 (0.22%) SAP MDM
2 1 (0.22%) Shopify
Cloud Services
1 135 (29.87%) Azure
2 109 (24.12%) Power Platform
3 43 (9.51%) AWS
4 39 (8.63%) GCP
5 31 (6.86%) Microsoft 365
6 28 (6.19%) Microsoft Purview
7 27 (5.97%) Azure Data Factory
8 19 (4.20%) Azure Synapse Analytics
8 19 (4.20%) Collibra
8 19 (4.20%) Snowflake
9 12 (2.65%) Azure Sentinel
10 10 (2.21%) Azure Cosmos DB
10 10 (2.21%) dbt
11 9 (1.99%) Serverless
12 8 (1.77%) Amazon S3
13 7 (1.55%) Azure Monitor
14 6 (1.33%) Cloud Composer
14 6 (1.33%) Google Analytics
14 6 (1.33%) Matillion
14 6 (1.33%) Power Automate
Communications & Networking
1 6 (1.33%) Cisco IPT
2 2 (0.44%) VPN
3 1 (0.22%) RIP
3 1 (0.22%) Skype
3 1 (0.22%) WebEx
Database & Business Intelligence
1 106 (23.45%) Power BI
2 95 (21.02%) Data Warehouse
3 69 (15.27%) Tableau
4 45 (9.96%) Data Lake
5 36 (7.96%) Metadata
6 29 (6.42%) Big Data
7 26 (5.75%) BigQuery
8 20 (4.42%) SQL Server
9 16 (3.54%) Looker
10 12 (2.65%) Azure SQL Database
10 12 (2.65%) SQL Server Integration Services
11 11 (2.43%) Amazon Redshift
12 10 (2.21%) Data Hub
12 10 (2.21%) MySQL
13 8 (1.77%) Data Vault
13 8 (1.77%) Hadoop
14 7 (1.55%) Data Mining
14 7 (1.55%) PostgreSQL
15 5 (1.11%) Apache Cassandra
15 5 (1.11%) Relational Database
Development Applications
1 16 (3.54%) Git
2 14 (3.10%) JIRA
3 9 (1.99%) GitLab
4 7 (1.55%) Jenkins
5 5 (1.11%) MLflow
6 3 (0.66%) ERwin
7 2 (0.44%) ER Studio
8 1 (0.22%) Selenium
8 1 (0.22%) Spinnaker
8 1 (0.22%) WebDriver
General
1 146 (32.30%) Social Skills
2 139 (30.75%) Finance
3 113 (25.00%) Analytical Skills
4 68 (15.04%) Public Sector
5 45 (9.96%) Banking
6 33 (7.30%) Inclusion and Diversity
7 32 (7.08%) Legal
8 23 (5.09%) Retail
9 15 (3.32%) Influencing Skills
10 11 (2.43%) Law
10 11 (2.43%) Marketing
11 10 (2.21%) Advertising
11 10 (2.21%) Presentation Skills
12 7 (1.55%) Back Office
12 7 (1.55%) Games
13 6 (1.33%) Military
14 5 (1.11%) Pharmaceutical
15 4 (0.88%) Billing
15 4 (0.88%) Organisational Skills
15 4 (0.88%) Wearables
Job Titles
1 83 (18.36%) Lead
2 81 (17.92%) Data Engineer
3 61 (13.50%) Architect
4 56 (12.39%) Data Manager
5 51 (11.28%) Analyst
6 50 (11.06%) Senior
7 46 (10.18%) Data Architect
8 34 (7.52%) Data Analyst
9 27 (5.97%) Senior Data Engineer
10 23 (5.09%) Data Governance Analyst
10 23 (5.09%) Data Governance Manager
10 23 (5.09%) Governance Manager
11 22 (4.87%) Consultant
11 22 (4.87%) Governance Analyst
12 16 (3.54%) Developer
13 15 (3.32%) Lead Data Engineer
14 14 (3.10%) Enterprise Architect
15 13 (2.88%) Azure Data Engineer
15 13 (2.88%) Azure Engineer
15 13 (2.88%) Data Steward
Libraries, Frameworks & Software Standards
1 24 (5.31%) PySpark
2 7 (1.55%) Microsoft Graph
3 6 (1.33%) JSON
3 6 (1.33%) Kafka
3 6 (1.33%) ModSecurity
4 5 (1.11%) Apache Beam
5 4 (0.88%) Middleware
6 2 (0.44%) Great Expectations
7 1 (0.22%) Django
7 1 (0.22%) GraphQL
7 1 (0.22%) Node.js
7 1 (0.22%) NumPy
7 1 (0.22%) Pandas
7 1 (0.22%) REST
7 1 (0.22%) scikit-learn
7 1 (0.22%) Spark Streaming
7 1 (0.22%) XML
Miscellaneous
1 39 (8.63%) Management Information System
2 18 (3.98%) Product Ownership
3 16 (3.54%) Reference Data
4 15 (3.32%) Cloud Native
4 15 (3.32%) Onboarding
5 14 (3.10%) Algorithms
5 14 (3.10%) Analytical Mindset
5 14 (3.10%) Data Structures
6 13 (2.88%) Data Centre
7 12 (2.65%) Legacy Systems
8 11 (2.43%) Freedom of Information
8 11 (2.43%) Taxonomies
9 10 (2.21%) Greenfield Project
9 10 (2.21%) Mainframe
10 9 (1.99%) NHS
11 8 (1.77%) Mobile App
12 7 (1.55%) Distributed Systems
12 7 (1.55%) Hybrid Cloud
12 7 (1.55%) Renewable Energy
13 5 (1.11%) IoT
Operating Systems
1 7 (1.55%) Windows
1 7 (1.55%) Windows Server
2 4 (0.88%) Linux
Processes & Methodologies
1 154 (34.07%) Business Intelligence
2 153 (33.85%) Analytics
3 139 (30.75%) Data Modelling
4 132 (29.20%) Data Management
5 112 (24.78%) Data Architecture
6 106 (23.45%) Data Analysis
7 95 (21.02%) Problem-Solving
8 91 (20.13%) Agile
8 91 (20.13%) Data Engineering
9 85 (18.81%) Mentoring
10 82 (18.14%) Continuous Improvement
11 75 (16.59%) Data Strategy
11 75 (16.59%) ETL
12 73 (16.15%) Data Science
13 68 (15.04%) Data Analytics
14 65 (14.38%) Stakeholder Management
15 61 (13.50%) Visualisation
16 56 (12.39%) Data Pipeline
17 54 (11.95%) Data Integration
18 53 (11.73%) Coaching
Programming Languages
1 191 (42.26%) SQL
2 78 (17.26%) Python
3 17 (3.76%) T-SQL
4 8 (1.77%) PL/SQL
5 7 (1.55%) R
6 5 (1.11%) C#
6 5 (1.11%) Perl
6 5 (1.11%) Shell Script
7 4 (0.88%) Data Analysis Expressions
7 4 (0.88%) Java
8 3 (0.66%) Scala
8 3 (0.66%) VBA
9 1 (0.22%) JavaScript
Qualifications
1 50 (11.06%) Degree
2 25 (5.53%) Security Cleared
3 21 (4.65%) Master's Degree
4 18 (3.98%) Computer Science Degree
5 16 (3.54%) SC Cleared
6 13 (2.88%) CISM
6 13 (2.88%) CISSP
7 8 (1.77%) DBS Check
8 6 (1.33%) CISA
8 6 (1.33%) Microsoft Certification
9 5 (1.11%) DV Cleared
10 4 (0.88%) BPSS Clearance
11 2 (0.44%) TOGAF Certification
12 1 (0.22%) Azure Certification
12 1 (0.22%) PMI Certification
12 1 (0.22%) PMP
Quality Assurance & Compliance
1 139 (30.75%) Data Quality
2 40 (8.85%) GDPR
3 10 (2.21%) QA
4 9 (1.99%) Actionable Recommendations
5 8 (1.77%) Accessibility
5 8 (1.77%) ISO/IEC 27001
6 7 (1.55%) COBIT
7 6 (1.33%) Cyber Essentials
7 6 (1.33%) Cyber Essentials PLUS
7 6 (1.33%) NCSC
8 4 (0.88%) Solvency II
9 2 (0.44%) California Consumer Privacy Act
10 1 (0.22%) GRC
10 1 (0.22%) GxP
10 1 (0.22%) HIPAA
10 1 (0.22%) MiFID
10 1 (0.22%) NIST
10 1 (0.22%) PCI DSS
10 1 (0.22%) PMO
System Software
1 12 (2.65%) Active Directory
2 2 (0.44%) Docker
Systems Management
1 18 (3.98%) Kubernetes
2 16 (3.54%) Terraform
3 7 (1.55%) SysTrack
4 4 (0.88%) Ansible
5 1 (0.22%) Systems Management Server (SMS)
5 1 (0.22%) Thomson Reuters DACS
Vendors
1 75 (16.59%) Microsoft
2 67 (14.82%) Databricks
3 17 (3.76%) Google
4 13 (2.88%) SAP
5 11 (2.43%) ServiceNow
6 10 (2.21%) Informatica
6 10 (2.21%) Teradata
7 9 (1.99%) Oracle
8 8 (1.77%) Northgate
9 7 (1.55%) Cisco
9 7 (1.55%) Snow
10 4 (0.88%) Dell
11 3 (0.66%) Salesforce
12 2 (0.44%) Alteryx
12 2 (0.44%) Bloomberg
12 2 (0.44%) Facebook
12 2 (0.44%) Refinitiv
12 2 (0.44%) Sage
12 2 (0.44%) Talend
12 2 (0.44%) TIBCO