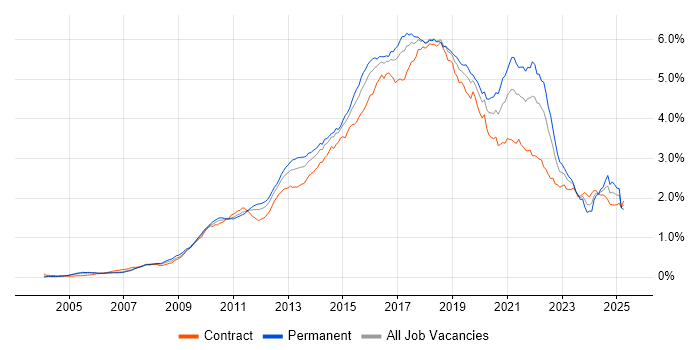
Continuous Integration Contracts in London

Continuous Integration
England > London

The table below provides summary statistics for contract job vacancies advertised in London requiring Continuous Integration skills. It includes a benchmarking guide to the contractor rates offered in vacancies that cited Continuous Integration over the 6 months leading up to 6 July 2025, comparing them to the same period in the previous two years.

6 months to
6 Jul 2025
Same period 2024 Same period 2023
Rank 151 108 103
Rank change year-on-year -43 -5 -12
Contract jobs citing Continuous Integration 233 409 634
As % of all contract jobs advertised in London 1.75% 2.32% 2.47%
As % of the Processes & Methodologies category 1.90% 2.63% 2.72%
Number of daily rates quoted 144 272 465
10th Percentile £402 £377 £458
25th Percentile £494 £458 £513
Median daily rate (50th Percentile) £570 £558 £600
Median % change year-on-year +2.15% -7.00% -5.88%
75th Percentile £675 £720 £738
90th Percentile £738 £861 £825
England median daily rate £525 £550 £600
% change year-on-year -4.55% -8.33% -
Number of hourly rates quoted 1 0 7
10th Percentile - - £69.30
25th Percentile - - £73.75
Median hourly rate £55.00 - £75.00
75th Percentile - - £76.25
90th Percentile - - £81.12
England median hourly rate £65.00 £65.00 £65.00
% change year-on-year - - -1.54%

All Process and Methodology Skills
London

Continuous Integration falls under the Processes and Methodologies category. For comparison with the information above, the following table provides summary statistics for all contract job vacancies requiring process or methodology skills in London.

Contract vacancies with a requirement for process or methodology skills 12,246 15,579 23,323
As % of all contract IT jobs advertised in London 92.17% 88.54% 90.71%
Number of daily rates quoted 8,177 11,085 16,913
10th Percentile £331 £340 £370
25th Percentile £425 £445 £470
Median daily rate (50th Percentile) £550 £550 £585
Median % change year-on-year - -5.98% +1.74%
75th Percentile £675 £680 £700
90th Percentile £799 £800 £800
England median daily rate £515 £525 £550
% change year-on-year -1.90% -4.55% -
Number of hourly rates quoted 226 294 268
10th Percentile £16.50 £15.96 £18.50
25th Percentile £24.66 £20.02 £23.00
Median hourly rate £32.00 £30.00 £40.77
Median % change year-on-year +6.67% -26.42% +13.25%
75th Percentile £50.50 £48.75 £65.00
90th Percentile £63.75 £68.75 £82.50
England median hourly rate £25.15 £38.12 £39.55
% change year-on-year -34.02% -3.62% +54.01%

Continuous Integration
Job Vacancy Trend in London

Job postings citing Continuous Integration as a proportion of all IT jobs advertised in London.

Job vacancy trend for Continuous Integration in London

Continuous Integration
Contractor Daily Rate Trend in London

3-month moving average daily rate quoted in jobs citing Continuous Integration in London.

Daily rate trend for Continuous Integration in London

Continuous Integration
Daily Rate Histogram in London

Daily rate distribution for jobs citing Continuous Integration in London over the 6 months to 6 July 2025.

Daily rate histogram for Continuous Integration in London

Continuous Integration
Contractor Hourly Rate Trend in London

3-month moving average hourly rates quoted in jobs citing Continuous Integration in London.

Hourly rate trend for Continuous Integration in London

Continuous Integration
Contract Job Locations in London

The table below looks at the demand and provides a guide to the median contractor rates quoted in IT jobs citing Continuous Integration within the London region over the 6 months to 6 July 2025. The 'Rank Change' column provides an indication of the change in demand within each location based on the same 6 month period last year.

Location Rank Change
on Same Period
Last Year
Matching
Contract
IT Job Ads
Median
Daily Rate
Past 6 Months
Median Daily Rate
% Change
on Same Period
Last Year
Live
Jobs
Central London -2 40 £580 +10.48% 60
South London +17 17 £550 +18.28% 4
West London +1 8 £431 +30.70% 3
East London +4 2 £250 -53.70% 3
Continuous Integration
England

Continuous Integration
Co-occurring Skills and Capabilities in London by Category

The follow tables expand on the table above by listing co-occurrences grouped by category. The same employment type, locality and period is covered with up to 20 co-occurrences shown in each of the following categories:

Application Platforms
1 9 (3.86%) Confluence
2 3 (1.29%) SharePoint
3 2 (0.86%) ArcGIS
4 1 (0.43%) Adobe Experience Manager
4 1 (0.43%) Anypoint
4 1 (0.43%) Apache
4 1 (0.43%) CMS
4 1 (0.43%) IIS
4 1 (0.43%) nginx
4 1 (0.43%) Oracle Coherence
4 1 (0.43%) WebLogic
Applications
1 1 (0.43%) Microsoft Excel
1 1 (0.43%) Microsoft Office
1 1 (0.43%) Microsoft PowerPoint
1 1 (0.43%) Microsoft Project
1 1 (0.43%) Trello
Business Applications
1 2 (0.86%) Shopify
Cloud Services
1 110 (47.21%) AWS
2 79 (33.91%) Azure
3 42 (18.03%) GCP
4 35 (15.02%) Azure DevOps
5 30 (12.88%) GitHub
6 26 (11.16%) Serverless
7 24 (10.30%) AWS CloudFormation
8 21 (9.01%) AWS Lambda
9 20 (8.58%) GitHub Actions
10 17 (7.30%) Amazon EC2
10 17 (7.30%) Amazon S3
11 12 (5.15%) Azure Monitor
12 10 (4.29%) Amazon EKS
12 10 (4.29%) AWS Step Functions
12 10 (4.29%) Cloud Computing
12 10 (4.29%) OpenShift
13 9 (3.86%) Azure API Management
14 8 (3.43%) Virtual Private Cloud
15 7 (3.00%) Azure Logic Apps
15 7 (3.00%) Route 53
Communications & Networking
1 18 (7.73%) DNS
2 15 (6.44%) TCP/IP
3 13 (5.58%) HTTP
4 11 (4.72%) Firewall
5 8 (3.43%) Internet
5 8 (3.43%) Network Security
5 8 (3.43%) VPN
6 2 (0.86%) HTTPS
6 2 (0.86%) Remote Desktop
7 1 (0.43%) Broadband
7 1 (0.43%) DHCP
7 1 (0.43%) Kerberos
7 1 (0.43%) LAN
7 1 (0.43%) Multicast
7 1 (0.43%) NAS
7 1 (0.43%) SAN
7 1 (0.43%) SSL
7 1 (0.43%) VLAN
7 1 (0.43%) Wi-Fi
7 1 (0.43%) Wireshark
Database & Business Intelligence
1 23 (9.87%) PostgreSQL
2 21 (9.01%) NoSQL
3 16 (6.87%) Amazon RDS
4 12 (5.15%) Relational Database
5 11 (4.72%) DynamoDB
6 10 (4.29%) Amazon Aurora
7 8 (3.43%) MongoDB
8 7 (3.00%) MySQL
8 7 (3.00%) SQL Server
9 6 (2.58%) BigQuery
9 6 (2.58%) Power BI
10 3 (1.29%) Apache Cassandra
10 3 (1.29%) Azure SQL Database
10 3 (1.29%) Big Data
10 3 (1.29%) Redis
11 2 (0.86%) Amazon Athena
11 2 (0.86%) Amazon Redshift
11 2 (0.86%) GIS
11 2 (0.86%) KDB
11 2 (0.86%) Oracle Database
Development Applications
1 76 (32.62%) Jenkins
2 49 (21.03%) Git
3 26 (11.16%) JIRA
4 14 (6.01%) Cypress.io
4 14 (6.01%) GitLab
5 13 (5.58%) Liquibase
6 12 (5.15%) CircleCI
7 11 (4.72%) SonarQube
7 11 (4.72%) TeamCity
8 10 (4.29%) Gradle
8 10 (4.29%) JUnit
9 7 (3.00%) Mockito
9 7 (3.00%) Subversion
10 6 (2.58%) Cucumber
10 6 (2.58%) JMeter
10 6 (2.58%) Maven
11 5 (2.15%) Selenium
11 5 (2.15%) webpack
12 4 (1.72%) IntelliJ
12 4 (1.72%) Visual Studio
General
1 68 (29.18%) Social Skills
2 48 (20.60%) Finance
3 20 (8.58%) Analytical Skills
4 16 (6.87%) Banking
5 15 (6.44%) Public Sector
6 14 (6.01%) Front Office
7 9 (3.86%) Financial Institution
8 8 (3.43%) Law
9 7 (3.00%) Marketing
10 6 (2.58%) Telecoms
11 5 (2.15%) Electronics
11 5 (2.15%) Inclusion and Diversity
11 5 (2.15%) Investment Banking
11 5 (2.15%) Manufacturing
12 3 (1.29%) Documentation Skills
12 3 (1.29%) Influencing Skills
12 3 (1.29%) Military
13 2 (0.86%) Retail
14 1 (0.43%) Presentation Skills
Job Titles
1 70 (30.04%) Developer
2 41 (17.60%) DevOps Engineer
3 39 (16.74%) Senior
4 25 (10.73%) Lead
5 22 (9.44%) Architect
5 22 (9.44%) Java Developer
6 15 (6.44%) Python Developer
7 11 (4.72%) AWS Engineer
7 11 (4.72%) Cloud Engineer
7 11 (4.72%) Java Engineer
7 11 (4.72%) React Developer
8 10 (4.29%) Azure Engineer
8 10 (4.29%) Senior Developer
9 8 (3.43%) Azure DevOps Engineer
9 8 (3.43%) Senior DevOps
9 8 (3.43%) Senior DevOps Engineer
10 7 (3.00%) AWS DevOps
10 7 (3.00%) Senior Architect
10 7 (3.00%) Software Engineer
10 7 (3.00%) Technical Architect
Libraries, Frameworks & Software Standards
1 35 (15.02%) React
2 28 (12.02%) Spring
3 20 (8.58%) Node.js
4 19 (8.15%) Kafka
5 18 (7.73%) REST
5 18 (7.73%) RESTful
6 15 (6.44%) GraphQL
6 15 (6.44%) Spring Boot
7 12 (5.15%) HTML
8 11 (4.72%) .NET
8 11 (4.72%) Elastic Stack
8 11 (4.72%) Web Services
9 10 (4.29%) Redux
10 9 (3.86%) ARM Templates
10 9 (3.86%) CSS
10 9 (3.86%) Express.js
11 8 (3.43%) FIX Protocol
11 8 (3.43%) HTML5
11 8 (3.43%) YAML
12 7 (3.00%) Middleware
Miscellaneous
1 20 (8.58%) Distributed Systems
2 19 (8.15%) Public Cloud
3 17 (7.30%) Data Structures
4 12 (5.15%) Algorithms
4 12 (5.15%) Foreign Exchange (FX)
5 10 (4.29%) Cloud Native
6 8 (3.43%) Derivative
6 8 (3.43%) Fixed Income
7 7 (3.00%) Enterprise Software
7 7 (3.00%) Virtual Team
8 6 (2.58%) Equities
8 6 (2.58%) Product Ownership
9 5 (2.15%) Data Protection Act
9 5 (2.15%) Hedge funds
10 3 (1.29%) Distributed Architecture
10 3 (1.29%) Greenfield Project
10 3 (1.29%) Legacy Code
10 3 (1.29%) Management Information System
10 3 (1.29%) Mobile App
10 3 (1.29%) Replication
Operating Systems
1 40 (17.17%) Linux
2 9 (3.86%) Windows
3 7 (3.00%) Android
3 7 (3.00%) Unix
4 5 (2.15%) Red Hat Enterprise Linux
5 2 (0.86%) Solaris
5 2 (0.86%) Windows Server
6 1 (0.43%) Apple iOS
6 1 (0.43%) CentOS
6 1 (0.43%) Debian
6 1 (0.43%) Oracle Linux
6 1 (0.43%) Ubuntu
Processes & Methodologies
1 153 (65.67%) CI/CD
2 120 (51.50%) DevOps
3 99 (42.49%) Agile
4 68 (29.18%) TDD
5 62 (26.61%) Test Automation
6 59 (25.32%) Continuous Delivery
7 56 (24.03%) Infrastructure as Code
8 54 (23.18%) Problem-Solving
9 48 (20.60%) Continuous Deployment
10 46 (19.74%) Microservices
11 43 (18.45%) Software Engineering
12 39 (16.74%) Containerisation
12 39 (16.74%) Mentoring
13 35 (15.02%) Design Patterns
14 33 (14.16%) Deployment Automation
15 29 (12.45%) Configuration Management
16 28 (12.02%) Scrum
17 21 (9.01%) Analytics
17 21 (9.01%) Computer Science
17 21 (9.01%) High Availability
Programming Languages
1 107 (45.92%) Python
2 95 (40.77%) Java
3 50 (21.46%) SQL
4 46 (19.74%) JavaScript
5 38 (16.31%) TypeScript
6 30 (12.88%) Bash
7 29 (12.45%) C#
8 19 (8.15%) PowerShell
9 16 (6.87%) C++
9 16 (6.87%) Go
10 11 (4.72%) Kotlin
11 8 (3.43%) C
11 8 (3.43%) Perl
12 7 (3.00%) Bicep
12 7 (3.00%) Shell Script
13 5 (2.15%) Groovy
13 5 (2.15%) PHP
14 3 (1.29%) Ruby
15 1 (0.43%) Korn
15 1 (0.43%) Objective-C
Qualifications
1 61 (26.18%) Security Cleared
2 54 (23.18%) SC Cleared
3 22 (9.44%) Degree
4 15 (6.44%) AWS Certification
4 15 (6.44%) Computer Science Degree
5 7 (3.00%) DV Cleared
5 7 (3.00%) Master's Degree
6 5 (2.15%) Azure Certification
7 4 (1.72%) AWS Certified Solutions Architect
8 3 (1.29%) AWS Certified Developer
8 3 (1.29%) AWS Certified DevOps Engineer
8 3 (1.29%) AWS Certified SysOps Administrator
8 3 (1.29%) BPSS Clearance
9 2 (0.86%) Microsoft Certification
9 2 (0.86%) PMI Certification
9 2 (0.86%) SAFe Agilist
9 2 (0.86%) TOGAF Certification
10 1 (0.43%) CISSP
10 1 (0.43%) MCAD
10 1 (0.43%) PMP
Quality Assurance & Compliance
1 27 (11.59%) QA
2 8 (3.43%) Data Quality
3 4 (1.72%) Accessibility
4 3 (1.29%) GDPR
5 2 (0.86%) ISO/IEC 27001
6 1 (0.43%) HL7
6 1 (0.43%) Sarbanes-Oxley
6 1 (0.43%) Software Quality Assurance
6 1 (0.43%) WCAG
System Software
1 61 (26.18%) Docker
2 9 (3.86%) Virtual Machines
3 5 (2.15%) Active Directory
4 2 (0.86%) OpenAM
4 2 (0.86%) OpenDJ
4 2 (0.86%) OpenIDM
4 2 (0.86%) Virtual Desktop
4 2 (0.86%) VMware Infrastructure
5 1 (0.43%) Postfix
5 1 (0.43%) VirtualBox
5 1 (0.43%) VMware ESXi
Systems Management
1 71 (30.47%) Kubernetes
2 55 (23.61%) Terraform
3 37 (15.88%) Ansible
4 26 (11.16%) Grafana
5 23 (9.87%) Prometheus
6 18 (7.73%) Puppet
7 17 (7.30%) Progress Chef
8 2 (0.86%) Consul
9 1 (0.43%) CloudHub
9 1 (0.43%) EMC NetWorker
9 1 (0.43%) Icinga
9 1 (0.43%) Nagios
9 1 (0.43%) Netcool
9 1 (0.43%) Packer
9 1 (0.43%) Salt
9 1 (0.43%) Tivoli
9 1 (0.43%) Tivoli Storage Manager
Vendors
1 24 (10.30%) Microsoft
2 11 (4.72%) Google
2 11 (4.72%) Oracle
2 11 (4.72%) Red Hat
3 7 (3.00%) SAP
4 5 (2.15%) Salesforce
4 5 (2.15%) Splunk
5 4 (1.72%) Dynatrace
6 3 (1.29%) Adobe
6 3 (1.29%) Atlassian
6 3 (1.29%) Murex
6 3 (1.29%) Sybase
7 2 (0.86%) CheckPoint
7 2 (0.86%) Cisco
7 2 (0.86%) Dell
7 2 (0.86%) New Relic
7 2 (0.86%) Sitecore
7 2 (0.86%) Thunderhead
7 2 (0.86%) TIBCO
7 2 (0.86%) VMware