Regulatory Compliance Contracts in London

Regulatory Compliance
England > London

The table below provides summary statistics for contract job vacancies advertised in London requiring Regulatory Compliance skills. It includes a benchmarking guide to the contractor rates offered in vacancies that cited Regulatory Compliance over the 6 months leading up to 16 May 2025, comparing them to the same period in the previous two years.

6 months to
16 May 2025
Same period 2024 Same period 2023
Rank 152 290 433
Rank change year-on-year +138 +143 +105
Contract jobs citing Regulatory Compliance 233 95 56
As % of all contract jobs advertised in London 1.88% 0.54% 0.22%
As % of the Processes & Methodologies category 2.04% 0.61% 0.24%
Number of daily rates quoted 164 57 38
10th Percentile £455 £350 £410
25th Percentile £609 £563 £440
Median daily rate (50th Percentile) £725 £650 £575
Median % change year-on-year +11.54% +13.04% -4.17%
75th Percentile £938 £788 £700
90th Percentile - £835 £726
England median daily rate £675 £600 £600
% change year-on-year +12.50% - +5.26%

All Process and Methodology Skills
London

Regulatory Compliance falls under the Processes and Methodologies category. For comparison with the information above, the following table provides summary statistics for all contract job vacancies requiring process or methodology skills in London.

Contract vacancies with a requirement for process or methodology skills 11,442 15,487 23,576
As % of all contract IT jobs advertised in London 92.24% 88.69% 90.94%
Number of daily rates quoted 7,745 11,095 17,006
10th Percentile £350 £343 £375
25th Percentile £435 £450 £475
Median daily rate (50th Percentile) £550 £550 £590
Median % change year-on-year - -6.78% +2.61%
75th Percentile £688 £688 £700
90th Percentile £805 £800 £800
England median daily rate £525 £525 £550
% change year-on-year - -4.55% +2.33%
Number of hourly rates quoted 173 307 268
10th Percentile £15.97 £15.77 £18.50
25th Percentile £22.75 £20.00 £22.50
Median hourly rate £34.00 £27.84 £38.25
Median % change year-on-year +22.13% -27.22% +2.00%
75th Percentile £50.75 £48.75 £64.31
90th Percentile £63.75 £66.60 £82.33
England median hourly rate £28.75 £36.50 £37.30
% change year-on-year -21.23% -2.14% +49.20%

Regulatory Compliance
Job Vacancy Trend in London

Job postings citing Regulatory Compliance as a proportion of all IT jobs advertised in London.
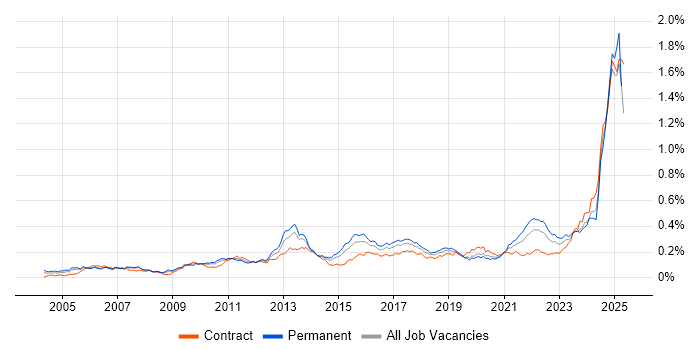
Job vacancy trend for Regulatory Compliance in London

Regulatory Compliance
Contractor Daily Rate Trend in London

3-month moving average daily rate quoted in jobs citing Regulatory Compliance in London.

Daily rate trend for Regulatory Compliance in London

Regulatory Compliance
Daily Rate Histogram in London

Daily rate distribution for jobs citing Regulatory Compliance in London over the 6 months to 16 May 2025.

Daily rate histogram for Regulatory Compliance in London

Regulatory Compliance
Contractor Hourly Rate Trend in London

3-month moving average hourly rates quoted in jobs citing Regulatory Compliance in London.

Hourly rate trend for Regulatory Compliance in London

Regulatory Compliance
Contract Job Locations in London

The table below looks at the demand and provides a guide to the median contractor rates quoted in IT jobs citing Regulatory Compliance within the London region over the 6 months to 16 May 2025. The 'Rank Change' column provides an indication of the change in demand within each location based on the same 6 month period last year.

Location Rank Change
on Same Period
Last Year
Matching
Contract
IT Job Ads
Median
Daily Rate
Past 6 Months
Median Daily Rate
% Change
on Same Period
Last Year
Live
Jobs
Central London +5 27 £481 -25.96% 21
East London - 2 £600 - 3
West London +13 1 £425 -46.88% 5
South London - 1 - - 1
Regulatory Compliance
England

Regulatory Compliance
Co-occurring Skills and Capabilities in London by Category

The follow tables expand on the table above by listing co-occurrences grouped by category. The same employment type, locality and period is covered with up to 20 co-occurrences shown in each of the following categories:

Application Platforms
1 9 (3.86%) Apache Spark
2 8 (3.43%) Apache
3 3 (1.29%) Confluence
3 3 (1.29%) SharePoint
4 2 (0.86%) SAS
5 1 (0.43%) Apache Airflow
Applications
1 4 (1.72%) Microsoft Excel
1 4 (1.72%) Microsoft Office
2 3 (1.29%) Microsoft Project
3 2 (0.86%) MS Visio
4 1 (0.43%) Microsoft PowerPoint
4 1 (0.43%) Trello
Business Applications
1 2 (0.86%) SAP S/4HANA
2 1 (0.43%) BASE24
2 1 (0.43%) Misys Midas
2 1 (0.43%) PeopleSoft Financials
2 1 (0.43%) SAP EWM
2 1 (0.43%) SAP GTS
2 1 (0.43%) SAP MDG
2 1 (0.43%) SAP PM
2 1 (0.43%) SAP Travel Management
2 1 (0.43%) Sparx Enterprise Architect
Cloud Services
1 15 (6.44%) Azure
2 12 (5.15%) SaaS
3 11 (4.72%) AWS
4 7 (3.00%) Power Platform
5 6 (2.58%) GCP
6 4 (1.72%) Power Automate
7 3 (1.29%) Alation
7 3 (1.29%) Collibra
7 3 (1.29%) Entra ID
7 3 (1.29%) OCI
7 3 (1.29%) PaaS
7 3 (1.29%) PowerApps
8 2 (0.86%) AWS CloudFormation
8 2 (0.86%) Azure Data Factory
8 2 (0.86%) Azure DevOps
8 2 (0.86%) Dynamics 365
8 2 (0.86%) Microsoft Purview
9 1 (0.43%) AWS Step Functions
9 1 (0.43%) GitHub Actions
9 1 (0.43%) Serverless
Communications & Networking
1 2 (0.86%) NAS
1 2 (0.86%) Network Security
1 2 (0.86%) SAN
2 1 (0.43%) ATM
2 1 (0.43%) Firewall
2 1 (0.43%) Intrusion Detection
2 1 (0.43%) SWIFTNet
2 1 (0.43%) TCP/IP
Database & Business Intelligence
1 93 (39.91%) Data Lake
2 14 (6.01%) Big Data
3 9 (3.86%) Hadoop
4 7 (3.00%) Data Warehouse
4 7 (3.00%) Metadata
5 4 (1.72%) Power BI
6 3 (1.29%) Data Mining
7 2 (0.86%) BigQuery
7 2 (0.86%) Electronic Patient Records
7 2 (0.86%) Relational Database
8 1 (0.43%) Amazon RDS
8 1 (0.43%) DynamoDB
8 1 (0.43%) NoSQL
8 1 (0.43%) Oracle Database
8 1 (0.43%) Oracle Database 12c
8 1 (0.43%) SAP BW
8 1 (0.43%) SAP Data Services
8 1 (0.43%) SAP HANA
8 1 (0.43%) Snowflake Schema
8 1 (0.43%) Star Schema
Development Applications
1 14 (6.01%) Jenkins
2 13 (5.58%) Git
3 7 (3.00%) JIRA
4 2 (0.86%) GitLab
5 1 (0.43%) ERwin
5 1 (0.43%) LSMW
General
1 183 (78.54%) Finance
2 91 (39.06%) Front Office
3 48 (20.60%) Social Skills
4 45 (19.31%) Banking
5 30 (12.88%) Analytical Skills
6 15 (6.44%) Legal
7 10 (4.29%) Financial Institution
7 10 (4.29%) Investment Banking
8 8 (3.43%) Retail Banking
9 7 (3.00%) Law
10 5 (2.15%) Public Sector
10 5 (2.15%) Retail
11 4 (1.72%) Documentation Skills
11 4 (1.72%) Pharmaceutical
11 4 (1.72%) Presentation Skills
11 4 (1.72%) Telecoms
12 2 (0.86%) Corporate Banking
13 1 (0.43%) General Ledger
13 1 (0.43%) International Banking
13 1 (0.43%) Marketing
Job Titles
1 38 (16.31%) Lead
2 37 (15.88%) Head of Finance
3 36 (15.45%) Analyst
4 33 (14.16%) Business Analyst
5 19 (8.15%) Data Governance Analyst
5 19 (8.15%) Data Governance Manager
5 19 (8.15%) Governance Manager
6 17 (7.30%) Senior
7 16 (6.87%) Architect
7 16 (6.87%) Head of Data Management
8 14 (6.01%) Programme Manager
9 13 (5.58%) Finance Manager
10 11 (4.72%) Developer
10 11 (4.72%) Project Manager
11 8 (3.43%) Apache Spark Developer
11 8 (3.43%) Data Business Analyst
11 8 (3.43%) Java Developer
11 8 (3.43%) Product Manager
12 6 (2.58%) Finance Business Analyst
12 6 (2.58%) Senior Architect
Libraries, Frameworks & Software Standards
1 9 (3.86%) Spark Streaming
2 7 (3.00%) SailPoint
3 4 (1.72%) FHIR
4 3 (1.29%) XML
5 2 (0.86%) JSON
5 2 (0.86%) OAuth
5 2 (0.86%) PySpark
5 2 (0.86%) RESTful
5 2 (0.86%) SAML
6 1 (0.43%) ARM Templates
6 1 (0.43%) Elastic Stack
6 1 (0.43%) ISPF
6 1 (0.43%) Kafka
6 1 (0.43%) Murex MxML
6 1 (0.43%) OpenID
6 1 (0.43%) Oracle GoldenGate
6 1 (0.43%) pytest
6 1 (0.43%) REST
6 1 (0.43%) SAP TM
6 1 (0.43%) web3js
Miscellaneous
1 90 (38.63%) Foreign Exchange (FX)
2 89 (38.20%) Derivative
3 88 (37.77%) Fixed Income
4 87 (37.34%) Equities
5 86 (36.91%) Hedge funds
6 29 (12.45%) Product Ownership
7 14 (6.01%) Market Risk
8 9 (3.86%) Analytical Mindset
8 9 (3.86%) Distributed Computing
8 9 (3.86%) Onboarding
9 5 (2.15%) Management Information System
9 5 (2.15%) Security Posture
10 4 (1.72%) Data Centre
11 3 (1.29%) Cloud Native
11 3 (1.29%) Credit Risk
11 3 (1.29%) Data Structures
11 3 (1.29%) Legacy Systems
11 3 (1.29%) Operational Technology
11 3 (1.29%) Self-Motivation
12 2 (0.86%) Insider Threat
Operating Systems
1 5 (2.15%) Linux
1 5 (2.15%) Unix
2 2 (0.86%) Red Hat Enterprise Linux
3 1 (0.43%) Windows
3 1 (0.43%) zOS
Processes & Methodologies
1 104 (44.64%) Agile
2 103 (44.21%) Data Governance
3 95 (40.77%) Roadmaps
4 94 (40.34%) Migration
5 87 (37.34%) Investment Management
6 74 (31.76%) Data Management
7 56 (24.03%) Risk Management
8 43 (18.45%) Problem-Solving
9 33 (14.16%) Analytics
10 29 (12.45%) Stakeholder Management
11 19 (8.15%) Data Modelling
12 18 (7.73%) CI/CD
12 18 (7.73%) Project Management
13 17 (7.30%) Cybersecurity
13 17 (7.30%) Incident Response
14 14 (6.01%) Data Pipeline
14 14 (6.01%) ITIL
15 13 (5.58%) Decision-Making
16 12 (5.15%) Regulatory Change
16 12 (5.15%) Risk Assessment
Programming Languages
1 20 (8.58%) SQL
2 19 (8.15%) Python
3 9 (3.86%) Java
4 4 (1.72%) PL/SQL
4 4 (1.72%) Shell Script
5 3 (1.29%) JavaScript
6 2 (0.86%) Bash
7 1 (0.43%) ABAP
7 1 (0.43%) Assembly Language
7 1 (0.43%) BeanShell
7 1 (0.43%) C#
7 1 (0.43%) CLIST
7 1 (0.43%) COBOL
7 1 (0.43%) Go
7 1 (0.43%) JCL
7 1 (0.43%) REXX
7 1 (0.43%) VBA
Qualifications
1 21 (9.01%) Degree
2 12 (5.15%) CISSP
3 10 (4.29%) CISM
4 8 (3.43%) Security Cleared
5 7 (3.00%) PMP
5 7 (3.00%) SC Cleared
6 6 (2.58%) PMI Certification
7 5 (2.15%) CISA
8 3 (1.29%) Azure Certification
8 3 (1.29%) CRISC
8 3 (1.29%) ISO 27001 Lead Auditor
8 3 (1.29%) Master's Degree
9 2 (0.86%) AWS Certification
9 2 (0.86%) CBAP
10 1 (0.43%) (ISC)2 CCSP
10 1 (0.43%) CCSP
10 1 (0.43%) Cisco Certification
10 1 (0.43%) IIBA
10 1 (0.43%) Microsoft Certification
10 1 (0.43%) PCI QSA
Quality Assurance & Compliance
1 31 (13.30%) MiFID
2 24 (10.30%) GDPR
3 13 (5.58%) Data Quality
3 13 (5.58%) NIST
4 12 (5.15%) ISO/IEC 27001
5 10 (4.29%) Sarbanes-Oxley
6 9 (3.86%) HIPAA
7 6 (2.58%) PCI DSS
8 5 (2.15%) Accessibility
8 5 (2.15%) Basel III
8 5 (2.15%) California Consumer Privacy Act
8 5 (2.15%) EMIR
8 5 (2.15%) GRC
9 4 (1.72%) COBIT
9 4 (1.72%) QA
10 3 (1.29%) Basel II
10 3 (1.29%) COSO
10 3 (1.29%) PSD2
10 3 (1.29%) SOC 2
11 2 (0.86%) Dodd-Frank
System Software
1 3 (1.29%) Docker
1 3 (1.29%) Virtual Machines
2 2 (0.86%) Active Directory
2 2 (0.86%) Veritas Cluster Server
2 2 (0.86%) Virtual Servers
2 2 (0.86%) VMware Infrastructure
3 1 (0.43%) Oracle RAC
3 1 (0.43%) Time Sharing Option
Systems Management
1 7 (3.00%) Kubernetes
2 6 (2.58%) Terraform
3 5 (2.15%) Ansible
4 4 (1.72%) Data Guard
5 2 (0.86%) CASB
5 2 (0.86%) Single Sign-On
6 1 (0.43%) Grafana
6 1 (0.43%) Kubeflow
6 1 (0.43%) OMEGAMON
6 1 (0.43%) Oracle Enterprise Manager
6 1 (0.43%) Oracle RMAN
6 1 (0.43%) Prometheus
6 1 (0.43%) Puppet
Vendors
1 13 (5.58%) Microsoft
1 13 (5.58%) ServiceNow
2 10 (4.29%) Oracle
3 6 (2.58%) SAP
4 4 (1.72%) Avaloq
4 4 (1.72%) CyberArk
5 3 (1.29%) Informatica
5 3 (1.29%) Sparx
6 2 (0.86%) AppDynamics
6 2 (0.86%) Dell
6 2 (0.86%) EMC
6 2 (0.86%) HP
6 2 (0.86%) IBM
6 2 (0.86%) Murex
6 2 (0.86%) NetApp
6 2 (0.86%) Okta
6 2 (0.86%) Pure Storage
6 2 (0.86%) Red Hat
6 2 (0.86%) Veritas
6 2 (0.86%) VMware