High Availability Contract Job Trends in London

High Availability
England > London

The table below provides summary statistics and contractor rates for jobs advertised in London requiring High Availability skills. It covers contract job vacancies from the 6 months leading up to 27 November 2025, with comparisons to the same periods in the previous two years.

6 months to
27 Nov 2025
Same period 2024 Same period 2023
Rank 186 170 192
Rank change year-on-year -16 +22 +56
Contract jobs citing High Availability 219 241 248
As % of all contract jobs in London 1.54% 1.51% 1.27%
As % of the Processes & Methodologies category 1.67% 1.69% 1.42%
Number of daily rates quoted 153 156 188
10th Percentile £388 £313 £371
25th Percentile £450 £462 £499
Median daily rate (50th Percentile) £550 £575 £600
Median % change year-on-year -4.35% -4.17% -
75th Percentile £713 £675 £688
90th Percentile £800 £775 £700
England median daily rate £500 £548 £560
% change year-on-year -8.68% -2.23% -2.61%
Number of hourly rates quoted 3 7 4
10th Percentile £23.60 £22.26 £62.22
25th Percentile £24.50 - £73.05
Median hourly rate £26.00 £23.80 £86.41
Median % change year-on-year +9.24% -72.46% +236.08%
75th Percentile - - £90.94
90th Percentile - £54.28 £92.63
England median hourly rate £69.63 £23.80 £82.81
% change year-on-year +192.55% -71.26% +222.09%

All Process and Methodology Skills
London

High Availability falls under the Processes and Methodologies category. For comparison with the information above, the following table provides summary statistics for all contract job vacancies requiring process or methodology skills in London.

Contract vacancies with a requirement for process or methodology skills 13,115 14,259 17,505
As % of all contract IT jobs advertised in London 92.27% 89.59% 89.70%
Number of daily rates quoted 8,616 9,203 12,553
10th Percentile £335 £350 £355
25th Percentile £425 £450 £460
Median daily rate (50th Percentile) £527 £550 £568
Median % change year-on-year -4.14% -3.08% -3.81%
75th Percentile £650 £675 £688
90th Percentile £775 £800 £799
England median daily rate £501 £525 £548
% change year-on-year -4.67% -4.11% -0.45%
Number of hourly rates quoted 253 172 238
10th Percentile £18.25 £17.25 £18.55
25th Percentile £24.50 £23.80 £21.50
Median hourly rate £29.50 £37.50 £35.44
Median % change year-on-year -21.33% +5.81% -10.28%
75th Percentile £47.50 £55.81 £60.00
90th Percentile £67.30 £80.75 £75.38
England median hourly rate £25.15 £35.43 £45.00
% change year-on-year -29.01% -21.27% +23.29%

High Availability
Job Vacancy Trend in London

Historical trend showing the proportion of contract IT job postings citing High Availability relative to all contract IT jobs advertised in London.
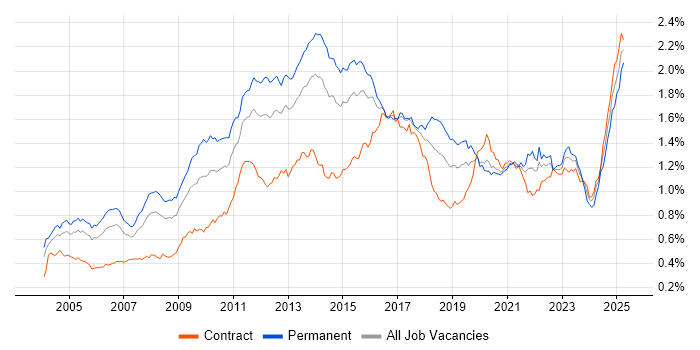
High Availability job vacancy trend in London

High Availability
Daily Rate Trend in London

Contractor daily rate distribution trend for jobs in London citing High Availability.

Contractor daily rate distribution trend for jobs in London citing High Availability

High Availability
Daily Rate Histogram in London

Daily rate distribution for jobs citing High Availability in London over the 6 months to 27 November 2025.

Daily rate histogram for High Availability in London

High Availability
Hourly Rate Trend in London

Contractor hourly rate distribution trend for jobs in London citing High Availability.

Contractor hourly rate distribution trend for jobs in London citing High Availability

High Availability
Contract Job Locations in London

The table below looks at the demand and provides a guide to the median contractor rates quoted in IT jobs citing High Availability within the London region over the 6 months to 27 November 2025. The 'Rank Change' column provides an indication of the change in demand within each location based on the same 6 month period last year.

Location Rank Change
on Same Period
Last Year
Matching
Contract
IT Job Ads
Median
Daily Rate
Past 6 Months
Median Daily Rate
% Change
on Same Period
Last Year
Live
Jobs
Central London -17 37 £600 +4.35% 19
South London - 8 £738 - 1
West London -11 6 £375 -21.05%
High Availability
England

High Availability
Co-Occurring Skills & Capabilities in London by Category

The following tables expand on the one above by listing co-occurrences grouped by category. They cover the same employment type, locality and period, with up to 20 co-occurrences shown in each category:

Application Platforms
1 3 (1.37%) Apache
1 3 (1.37%) Apache Spark
1 3 (1.37%) CICS
1 3 (1.37%) Confluence
1 3 (1.37%) Ethereum
1 3 (1.37%) Hyperledger
1 3 (1.37%) Microsoft Exchange
2 2 (0.91%) CMS
2 2 (0.91%) Headless CMS
2 2 (0.91%) nginx
2 2 (0.91%) Oracle HTTP Server
2 2 (0.91%) SAS
2 2 (0.91%) Tomcat
2 2 (0.91%) WebLogic
3 1 (0.46%) Apache Airflow
3 1 (0.46%) Drupal
3 1 (0.46%) OpenStack
3 1 (0.46%) SharePoint
3 1 (0.46%) WordPress
Applications
1 1 (0.46%) Chatbot
1 1 (0.46%) Microsoft Excel
1 1 (0.46%) Microsoft Office
1 1 (0.46%) Weka
Business Applications
1 6 (2.74%) SAP S/4HANA
2 1 (0.46%) Eikon
2 1 (0.46%) Eze OMS
2 1 (0.46%) Fidessa
Cloud Services
1 63 (28.77%) AWS
2 55 (25.11%) Azure
3 26 (11.87%) GitHub
4 25 (11.42%) Amazon S3
5 24 (10.96%) Serverless
6 23 (10.50%) Amazon CloudWatch
7 21 (9.59%) AWS Lambda
7 21 (9.59%) Virtual Private Cloud
8 19 (8.68%) GCP
9 17 (7.76%) Amazon EC2
10 14 (6.39%) AWS CloudFormation
11 13 (5.94%) GitHub Actions
12 12 (5.48%) Azure DevOps
13 10 (4.57%) Amazon ECS
13 10 (4.57%) Amazon EKS
14 9 (4.11%) Akamai
14 9 (4.11%) Amazon ELB
15 7 (3.20%) Datadog
15 7 (3.20%) Entra ID
15 7 (3.20%) Google Kubernetes Engine
Communications & Networking
1 40 (18.26%) Firewall
2 31 (14.16%) DNS
3 28 (12.79%) TCP/IP
4 24 (10.96%) VPN
5 16 (7.31%) Network Security
6 15 (6.85%) Multicast
6 15 (6.85%) SSL
6 15 (6.85%) Wireshark
7 13 (5.94%) WAN
8 12 (5.48%) BGP
9 11 (5.02%) DHCP
9 11 (5.02%) OSPF
10 9 (4.11%) HTTP
11 8 (3.65%) 4G
11 8 (3.65%) Cisco Nexus
11 8 (3.65%) LAN
12 7 (3.20%) Cisco ISE
12 7 (3.20%) F5 BIG-IP LTM
12 7 (3.20%) LTE
12 7 (3.20%) Radio Access Network
Database & Business Intelligence
1 17 (7.76%) PostgreSQL
2 15 (6.85%) NoSQL
3 13 (5.94%) Relational Database
4 8 (3.65%) Amazon RDS
4 8 (3.65%) MongoDB
4 8 (3.65%) MySQL
5 7 (3.20%) Elasticsearch
6 6 (2.74%) SQL Server
7 5 (2.28%) DynamoDB
8 4 (1.83%) Azure SQL Database
8 4 (1.83%) DB2
8 4 (1.83%) RDBMS
9 3 (1.37%) Data Warehouse
9 3 (1.37%) Metadata
9 3 (1.37%) Oracle Database
10 2 (0.91%) Amazon Aurora
10 2 (0.91%) Big Data
10 2 (0.91%) Data Lake
10 2 (0.91%) Oracle Exadata
10 2 (0.91%) SAP Data Services
Development Applications
1 35 (15.98%) Jenkins
2 26 (11.87%) Git
3 21 (9.59%) GitLab
4 10 (4.57%) GCC
5 9 (4.11%) GDB
5 9 (4.11%) JIRA
6 4 (1.83%) Cypress.io
6 4 (1.83%) Robot Framework
6 4 (1.83%) Subversion
6 4 (1.83%) TeamCity
7 3 (1.37%) Sonatype Nexus
8 2 (0.91%) Artifactory
8 2 (0.91%) Bitbucket
8 2 (0.91%) IBM UrbanCode
8 2 (0.91%) JUnit
8 2 (0.91%) MLflow
8 2 (0.91%) SonarQube
8 2 (0.91%) Team Foundation Server
9 1 (0.46%) Gradle
9 1 (0.46%) Mocha
General
1 84 (38.36%) Social Skills
2 55 (25.11%) Finance
3 30 (13.70%) Analytical Skills
4 26 (11.87%) Banking
5 14 (6.39%) Front Office
6 13 (5.94%) Public Sector
7 9 (4.11%) Inclusion and Diversity
7 9 (4.11%) Telecoms
8 8 (3.65%) Influencing Skills
8 8 (3.65%) International Banking
9 7 (3.20%) Financial Institution
10 6 (2.74%) Retail
11 4 (1.83%) Documentation Skills
11 4 (1.83%) Investment Banking
11 4 (1.83%) Legal
12 3 (1.37%) Organisational Skills
12 3 (1.37%) Presentation Skills
13 2 (0.91%) Digital Healthcare
13 2 (0.91%) Manufacturing
13 2 (0.91%) Publishing
Job Titles
1 29 (13.24%) Developer
2 27 (12.33%) Senior
3 21 (9.59%) DevOps Engineer
4 20 (9.13%) Architect
5 18 (8.22%) Lead
6 17 (7.76%) Network Engineer
7 12 (5.48%) Infrastructure Engineer
8 9 (4.11%) Consultant
8 9 (4.11%) Senior DevOps
8 9 (4.11%) Senior DevOps Engineer
9 8 (3.65%) C++ Developer
9 8 (3.65%) Network Specialist
10 7 (3.20%) Administrator
10 7 (3.20%) Network Design Specialist
10 7 (3.20%) Performance Specialist
10 7 (3.20%) Project Manager
11 6 (2.74%) Cloud Architect
11 6 (2.74%) DBA
11 6 (2.74%) Java Engineer
11 6 (2.74%) Site Reliability Engineer
Libraries, Frameworks & Software Standards
1 18 (8.22%) FIX Protocol
1 18 (8.22%) Middleware
2 15 (6.85%) REST
3 14 (6.39%) RESTful
4 13 (5.94%) Spring
5 12 (5.48%) OAuth
6 10 (4.57%) .NET
6 10 (4.57%) JSON
6 10 (4.57%) Kafka
7 9 (4.11%) Boost C++ Libraries
7 9 (4.11%) Elastic Stack
7 9 (4.11%) Spring Boot
7 9 (4.11%) STL
7 9 (4.11%) XML
8 8 (3.65%) OAuth2
9 7 (3.20%) ARM Templates
9 7 (3.20%) Node.js
10 5 (2.28%) FpML
10 5 (2.28%) OpenID
10 5 (2.28%) Ultra Messaging
Miscellaneous
1 38 (17.35%) Cloud Native
2 24 (10.96%) Replication
3 19 (8.68%) Foreign Exchange (FX)
4 17 (7.76%) Data Centre
5 15 (6.85%) Distributed Systems
5 15 (6.85%) Hybrid Cloud
6 12 (5.48%) Distributed Architecture
7 11 (5.02%) Clustering
8 10 (4.57%) Mainframe
8 10 (4.57%) Onboarding
9 9 (4.11%) Algorithms
10 8 (3.65%) Fixed Income
11 7 (3.20%) Product Ownership
12 6 (2.74%) Derivative
13 5 (2.28%) Data Structures
13 5 (2.28%) Private Cloud
13 5 (2.28%) Public Cloud
14 4 (1.83%) Data Protection Act
14 4 (1.83%) Self-Motivation
15 3 (1.37%) DataPower
Operating Systems
1 51 (23.29%) Linux
2 21 (9.59%) Windows
3 16 (7.31%) Red Hat Enterprise Linux
4 9 (4.11%) Unix
5 8 (3.65%) VMS
5 8 (3.65%) Windows Server
6 5 (2.28%) CentOS
6 5 (2.28%) Solaris
6 5 (2.28%) Ubuntu
6 5 (2.28%) zOS
7 3 (1.37%) Android
8 2 (0.91%) Apple iOS
8 2 (0.91%) Windows Server 2016
9 1 (0.46%) AIX
9 1 (0.46%) Windows 10
9 1 (0.46%) Windows Server 2019
Processes & Methodologies
1 90 (41.10%) DevOps
2 85 (38.81%) CI/CD
3 57 (26.03%) Problem-Solving
4 56 (25.57%) Infrastructure as Code
5 43 (19.63%) Agile
6 42 (19.18%) Containerisation
7 34 (15.53%) Microservices
8 32 (14.61%) Disaster Recovery
8 32 (14.61%) Root Cause Analysis
9 31 (14.16%) Low Latency
10 29 (13.24%) Continuous Improvement
11 28 (12.79%) Observability
12 24 (10.96%) Stakeholder Management
13 23 (10.50%) Migration
13 23 (10.50%) Performance Tuning
14 22 (10.05%) Infrastructure Automation
14 22 (10.05%) Mentoring
15 21 (9.59%) Data Protection
15 21 (9.59%) Incident Response
15 21 (9.59%) Test Automation
Programming Languages
1 88 (40.18%) Python
2 42 (19.18%) Bash
3 37 (16.89%) SQL
4 30 (13.70%) Java
5 24 (10.96%) PowerShell
6 14 (6.39%) C#
6 14 (6.39%) C++
7 12 (5.48%) Perl
8 9 (4.11%) JavaScript
9 6 (2.74%) Shell Script
10 5 (2.28%) Bicep
11 4 (1.83%) Go
11 4 (1.83%) REXX
12 3 (1.37%) Assembly Language
12 3 (1.37%) PHP
12 3 (1.37%) PromQL
12 3 (1.37%) T-SQL
12 3 (1.37%) TypeScript
13 2 (0.91%) Kotlin
13 2 (0.91%) Swift
Qualifications
1 28 (12.79%) Security Cleared
2 22 (10.05%) SC Cleared
3 11 (5.02%) AWS Certification
3 11 (5.02%) Degree
4 10 (4.57%) Computer Science Degree
5 8 (3.65%) AWS Certified Solutions Architect
5 8 (3.65%) Cisco Certification
6 7 (3.20%) CCNP
7 6 (2.74%) Azure Certification
8 5 (2.28%) ITIL Certification
9 4 (1.83%) CCIE
9 4 (1.83%) CCNA
10 3 (1.37%) AWS Certified DevOps Engineer
10 3 (1.37%) DV Cleared
11 2 (0.91%) CCDP
11 2 (0.91%) Microsoft Certification
11 2 (0.91%) PMI Certification
11 2 (0.91%) PMP
11 2 (0.91%) RHCE
11 2 (0.91%) VCAP
Quality Assurance & Compliance
1 8 (3.65%) GDPR
2 6 (2.74%) QA
3 4 (1.83%) Sarbanes-Oxley
4 2 (0.91%) Data Quality
4 2 (0.91%) HIPAA
5 1 (0.46%) Accessibility
5 1 (0.46%) California Consumer Privacy Act
5 1 (0.46%) NIST
5 1 (0.46%) PCI DSS
5 1 (0.46%) SLA
System Software
1 47 (21.46%) Docker
2 18 (8.22%) VMware Infrastructure
3 11 (5.02%) Active Directory
4 7 (3.20%) VMware ESXi
4 7 (3.20%) vSphere
5 6 (2.74%) NFS
6 5 (2.28%) Virtual Machines
6 5 (2.28%) VMware NSX
7 4 (1.83%) Hyper-V
7 4 (1.83%) Veritas File System
7 4 (1.83%) Veritas Volume Manager
8 3 (1.37%) GPFS
8 3 (1.37%) RACF
9 2 (0.91%) Virtual Desktop
10 1 (0.46%) Lustre
10 1 (0.46%) Microsoft App-V
10 1 (0.46%) Oracle RAC
10 1 (0.46%) Slurm Workload Manager
Systems Management
1 66 (30.14%) Terraform
2 49 (22.37%) Ansible
2 49 (22.37%) Kubernetes
3 18 (8.22%) Grafana
4 16 (7.31%) Prometheus
5 11 (5.02%) ITRS Geneos
6 10 (4.57%) FortiGate
7 8 (3.65%) Kibana
8 6 (2.74%) Red Hat Satellite
9 5 (2.28%) logstash
9 5 (2.28%) Puppet
9 5 (2.28%) vCenter Server
10 4 (1.83%) Microsoft Intune
10 4 (1.83%) OMEGAMON
10 4 (1.83%) QRadar
11 3 (1.37%) Argo
12 2 (0.91%) Istio
12 2 (0.91%) Rancher
12 2 (0.91%) SCCM
12 2 (0.91%) Single Sign-On
Vendors
1 21 (9.59%) F5
2 20 (9.13%) VMware
3 19 (8.68%) Splunk
4 18 (8.22%) Microsoft
5 17 (7.76%) Cisco
5 17 (7.76%) Red Hat
6 13 (5.94%) Palo Alto
6 13 (5.94%) Solace
7 10 (4.57%) Fortinet
8 9 (4.11%) CheckPoint
8 9 (4.11%) Nokia
9 8 (3.65%) Ericsson
9 8 (3.65%) SolarWinds
10 7 (3.20%) Actix
10 7 (3.20%) Databricks
10 7 (3.20%) Juniper
10 7 (3.20%) Oracle
10 7 (3.20%) SAP
11 6 (2.74%) Google
12 5 (2.28%) IBM