Data Pipeline Job Trends in London

Data Pipelines
England > London

The table below provides summary statistics and salary benchmarking for jobs advertised in London requiring Data Pipeline skills. It covers permanent job vacancies from the 6 months leading up to 29 October 2025, with comparisons to the same periods in the previous two years.

6 months to
29 Oct 2025
Same period 2024 Same period 2023
Rank 93 179 197
Rank change year-on-year +86 +18 -23
Permanent jobs citing Data Pipeline 406 324 323
As % of all permanent jobs in London 3.38% 1.86% 1.64%
As % of the Processes & Methodologies category 3.62% 2.06% 1.75%
Number of salaries quoted 240 171 273
10th Percentile £46,000 £52,500 £51,250
25th Percentile £61,250 £65,000 £63,750
Median annual salary (50th Percentile) £80,000 £75,000 £80,000
Median % change year-on-year +6.67% -6.25% -
75th Percentile £97,500 £97,500 £97,290
90th Percentile £122,750 £115,000 £120,000
England median annual salary £70,000 £70,000 £72,500
% change year-on-year - -3.45% -6.45%

All Process and Methodology Skills
London

Data Pipeline falls under the Processes and Methodologies category. For comparison with the information above, the following table provides summary statistics for all permanent job vacancies requiring process or methodology skills in London.

Permanent vacancies with a requirement for process or methodology skills 11,218 15,701 18,475
As % of all permanent jobs advertised in London 93.31% 90.02% 93.67%
Number of salaries quoted 7,177 9,363 15,023
10th Percentile £36,250 £42,500 £41,356
25th Percentile £51,263 £56,250 £55,000
Median annual salary (50th Percentile) £72,500 £75,000 £75,000
Median % change year-on-year -3.33% - +3.45%
75th Percentile £95,000 £97,500 £95,000
90th Percentile £120,000 £120,000 £116,250
England median annual salary £55,000 £60,000 £60,000
% change year-on-year -8.33% - -

Data Pipeline
Job Vacancy Trend in London

Historical trend showing the proportion of permanent IT job postings citing Data Pipeline relative to all permanent IT jobs advertised in London.
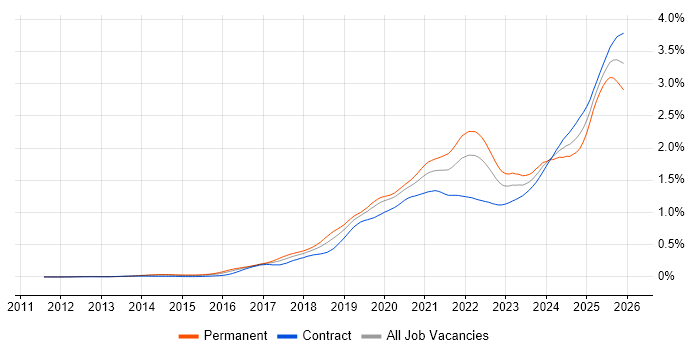
Data Pipeline job vacancy trend in London

Data Pipeline
Salary Trend in London

Salary distribution trend for jobs in London citing Data Pipeline.

Salary distribution trend for jobs in London citing Data Pipeline

Data Pipeline
Salary Histogram in London

Salary distribution for jobs citing Data Pipeline in London over the 6 months to 29 October 2025.

Salary histogram for Data Pipeline in London

Data Pipeline
Job Locations in London

The table below looks at the demand and provides a guide to the median salaries quoted in IT jobs citing Data Pipeline within the London region over the 6 months to 29 October 2025. The 'Rank Change' column provides an indication of the change in demand within each location based on the same 6 month period last year.

Location Rank Change
on Same Period
Last Year
Matching
Permanent
IT Job Ads
Median Salary
Past 6 Months
Median Salary
% Change
on Same Period
Last Year
Live
Jobs
Central London +49 68 £85,000 +13.33% 226
West London +10 8 £47,000 -34.04% 7
Data Pipeline
England

Data Pipeline
Co-Occurring Skills & Capabilities in London by Category

The following tables expand on the one above by listing co-occurrences grouped by category. They cover the same employment type, locality and period, with up to 20 co-occurrences shown in each category:

Application Platforms
1 73 (17.98%) Apache Spark
2 43 (10.59%) Apache Airflow
3 17 (4.19%) Apache
4 4 (0.99%) Confluence
5 2 (0.49%) nginx
5 2 (0.49%) SharePoint
6 1 (0.25%) IIS
6 1 (0.25%) Jupyter
6 1 (0.25%) Luigi
6 1 (0.25%) Oracle SOA Suite
6 1 (0.25%) SAS
Applications
1 6 (1.48%) Microsoft Excel
2 4 (0.99%) Microsoft Office
3 2 (0.49%) Microsoft PowerPoint
Business Applications
1 14 (3.45%) SAP S/4HANA
2 2 (0.49%) Dynamics CRM
2 2 (0.49%) Oracle EBS
2 2 (0.49%) Oracle ERP
3 1 (0.25%) Aladdin
3 1 (0.25%) Carpe Diem
3 1 (0.25%) Elite 3E
3 1 (0.25%) Markit EDM
3 1 (0.25%) NetSuite
3 1 (0.25%) Oracle BPM
3 1 (0.25%) SAP ERP
Cloud Services
1 210 (51.72%) Azure
2 174 (42.86%) AWS
3 106 (26.11%) Power Platform
4 83 (20.44%) GCP
5 74 (18.23%) Snowflake
6 49 (12.07%) dbt
7 45 (11.08%) Azure Data Factory
8 42 (10.34%) Serverless
9 37 (9.11%) Azure Synapse Analytics
10 33 (8.13%) GitHub
11 32 (7.88%) Amazon S3
11 32 (7.88%) AWS Lambda
12 27 (6.65%) Azure DevOps
12 27 (6.65%) Fivetran
13 18 (4.43%) AWS CloudFormation
14 17 (4.19%) AWS Step Functions
15 16 (3.94%) Amazon EMR
15 16 (3.94%) Amazon Kinesis
16 13 (3.20%) Amazon SageMaker
16 13 (3.20%) Azure Logic Apps
Communications & Networking
1 3 (0.74%) Kerberos
1 3 (0.74%) TCP/IP
2 2 (0.49%) BGP
2 2 (0.49%) Cisco Nexus
2 2 (0.49%) Firewall
2 2 (0.49%) MQTT
2 2 (0.49%) OSPF
2 2 (0.49%) Reverse Proxy
2 2 (0.49%) RTMP
2 2 (0.49%) VLAN
2 2 (0.49%) VPN
2 2 (0.49%) WAN
2 2 (0.49%) Wi-Fi
2 2 (0.49%) Wireless
3 1 (0.25%) Broadband
3 1 (0.25%) Network Security
Database & Business Intelligence
1 115 (28.33%) Data Warehouse
2 102 (25.12%) Power BI
3 70 (17.24%) SQL Server
4 60 (14.78%) Data Lake
5 54 (13.30%) Big Data
6 53 (13.05%) Metadata
7 42 (10.34%) Hadoop
8 40 (9.85%) Amazon Redshift
9 39 (9.61%) NoSQL
9 39 (9.61%) Tableau
10 28 (6.90%) Looker
11 26 (6.40%) PostgreSQL
12 23 (5.67%) Relational Database
13 21 (5.17%) Amazon Athena
14 17 (4.19%) DynamoDB
15 16 (3.94%) Azure SQL Database
15 16 (3.94%) MongoDB
16 15 (3.69%) Amazon RDS
16 15 (3.69%) Apache Iceberg
17 14 (3.45%) BigQuery
Development Applications
1 42 (10.34%) Git
2 16 (3.94%) Jenkins
3 9 (2.22%) JIRA
3 9 (2.22%) MLflow
4 4 (0.99%) ER Studio
4 4 (0.99%) ERwin
4 4 (0.99%) GitLab
4 4 (0.99%) Postman
4 4 (0.99%) PowerDesigner
4 4 (0.99%) Selenium
4 4 (0.99%) Spinnaker
4 4 (0.99%) Terragrunt
5 3 (0.74%) Browser DevTools
5 3 (0.74%) Charles Proxy
5 3 (0.74%) Fiddler
5 3 (0.74%) Maven
5 3 (0.74%) TestNG
5 3 (0.74%) WebDriver
5 3 (0.74%) Zephyr
6 2 (0.49%) Jaeger
General
1 181 (44.58%) Finance
2 171 (42.12%) Social Skills
3 96 (23.65%) Analytical Skills
4 77 (18.97%) Law
5 44 (10.84%) Marketing
6 36 (8.87%) Inclusion and Diversity
7 33 (8.13%) Public Sector
8 24 (5.91%) Manufacturing
9 22 (5.42%) Banking
10 17 (4.19%) Advertising
11 16 (3.94%) French Language
11 16 (3.94%) Retail
12 14 (3.45%) Electronics
13 13 (3.20%) Financial Institution
14 11 (2.71%) Telecoms
15 9 (2.22%) Influencing Skills
16 7 (1.72%) Front Office
17 6 (1.48%) Back Office
18 5 (1.23%) Pharmaceutical
19 4 (0.99%) Legal
Job Titles
1 166 (40.89%) Data Engineer
2 104 (25.62%) Senior
3 61 (15.02%) Senior Data Engineer
4 56 (13.79%) Lead
5 38 (9.36%) Analyst
6 32 (7.88%) Developer
7 24 (5.91%) AWS Engineer
8 22 (5.42%) Architect
9 21 (5.17%) Azure Engineer
10 19 (4.68%) Python Engineer
11 18 (4.43%) AWS Data Engineer
12 17 (4.19%) Data Architect
12 17 (4.19%) Product Lead
12 17 (4.19%) Senior Analyst
12 17 (4.19%) Software Engineer
13 14 (3.45%) Consultant
13 14 (3.45%) Data Scientist
14 13 (3.20%) Lead Developer
15 12 (2.96%) Azure Data Engineer
15 12 (2.96%) Python Developer
Libraries, Frameworks & Software Standards
1 57 (14.04%) Kafka
2 42 (10.34%) PySpark
3 19 (4.68%) React
4 17 (4.19%) TensorFlow
5 16 (3.94%) PyTorch
6 15 (3.69%) Pandas
7 13 (3.20%) Spark Streaming
8 10 (2.46%) REST
9 9 (2.22%) RESTful
10 8 (1.97%) Django
10 8 (1.97%) Keras
10 8 (1.97%) Node.js
11 7 (1.72%) AWS CDK
11 7 (1.72%) boto
11 7 (1.72%) pytest
11 7 (1.72%) scikit-learn
12 6 (1.48%) .NET
12 6 (1.48%) GraphQL
12 6 (1.48%) Spring
12 6 (1.48%) Tailwind CSS
Miscellaneous
1 42 (10.34%) Product Ownership
2 40 (9.85%) Distributed Systems
3 34 (8.37%) Cloud Native
4 25 (6.16%) Data Structures
5 22 (5.42%) Management Information System
6 21 (5.17%) FMCG
7 14 (3.45%) Greenfield Project
8 12 (2.96%) Hedge funds
9 10 (2.46%) Hybrid Cloud
9 10 (2.46%) Legacy Systems
10 9 (2.22%) e-Learning
11 8 (1.97%) Algorithms
11 8 (1.97%) Data Centre
11 8 (1.97%) Reinsurance
12 5 (1.23%) Distributed Architecture
12 5 (1.23%) Robotics
13 4 (0.99%) Derivative
13 4 (0.99%) Fixed Income
13 4 (0.99%) Mobile Banking
13 4 (0.99%) Public Cloud
Operating Systems
1 10 (2.46%) Linux
2 6 (1.48%) Unix
3 1 (0.25%) Windows
Processes & Methodologies
1 207 (50.99%) Data Engineering
1 207 (50.99%) ETL
2 179 (44.09%) Data Modelling
3 173 (42.61%) Analytics
4 161 (39.66%) CI/CD
5 130 (32.02%) Business Intelligence
6 129 (31.77%) DevOps
7 120 (29.56%) AI
8 119 (29.31%) Data Governance
9 118 (29.06%) Agile
10 117 (28.82%) Machine Learning
11 114 (28.08%) Problem-Solving
12 109 (26.85%) Data Science
13 101 (24.88%) Decision-Making
14 65 (16.01%) Software Engineering
15 63 (15.52%) Mentoring
15 63 (15.52%) Visualisation
16 62 (15.27%) Computer Science
17 56 (13.79%) Data Architecture
17 56 (13.79%) Data Integration
Programming Languages
1 281 (69.21%) Python
2 253 (62.32%) SQL
3 54 (13.30%) Java
4 33 (8.13%) Scala
5 20 (4.93%) C#
5 20 (4.93%) T-SQL
6 18 (4.43%) TypeScript
7 13 (3.20%) R
8 11 (2.71%) C++
9 10 (2.46%) JavaScript
10 7 (1.72%) Data Analysis Expressions
11 6 (1.48%) PL/SQL
12 4 (0.99%) Fortran
13 3 (0.74%) Bash
13 3 (0.74%) Bicep
13 3 (0.74%) PowerShell
14 1 (0.25%) Go
14 1 (0.25%) Kotlin
14 1 (0.25%) Kusto Query Language
14 1 (0.25%) SPARQL
Qualifications
1 85 (20.94%) Degree
2 41 (10.10%) Computer Science Degree
3 28 (6.90%) Security Cleared
4 24 (5.91%) SC Cleared
5 20 (4.93%) Master's Degree
6 18 (4.43%) DV Cleared
7 16 (3.94%) Microsoft Certification
8 13 (3.20%) Azure Certification
9 12 (2.96%) AWS Certification
10 8 (1.97%) CISSP
10 8 (1.97%) MCSE
10 8 (1.97%) OCP
10 8 (1.97%) Oracle Certification
11 7 (1.72%) PhD
12 6 (1.48%) SnowPro
13 4 (0.99%) AWS Certified Developer
13 4 (0.99%) AWS Certified Solutions Architect
13 4 (0.99%) DBS Check
14 2 (0.49%) Numerate Degree
14 2 (0.49%) TOGAF Certification
Quality Assurance & Compliance
1 107 (26.35%) Data Quality
2 34 (8.37%) QA
3 24 (5.91%) GDPR
4 12 (2.96%) Accessibility
5 4 (0.99%) ISO/IEC 27001
6 2 (0.49%) HIPAA
6 2 (0.49%) NIST
6 2 (0.49%) SOC 2
7 1 (0.25%) California Consumer Privacy Act
7 1 (0.25%) Cyber Essentials
7 1 (0.25%) Cyber Essentials PLUS
7 1 (0.25%) EU AI Act
7 1 (0.25%) NCSC
7 1 (0.25%) SNOMED CT
System Software
1 42 (10.34%) Docker
2 7 (1.72%) HDFS
3 3 (0.74%) Active Directory
4 2 (0.49%) NFS
5 1 (0.25%) Firmware
Systems Management
1 49 (12.07%) Terraform
2 40 (9.85%) Kubernetes
3 9 (2.22%) Ansible
3 9 (2.22%) Prometheus
4 7 (1.72%) Grafana
4 7 (1.72%) Kubeflow
5 2 (0.49%) Argo
6 1 (0.25%) Ambari
6 1 (0.25%) Control-M
6 1 (0.25%) Puppet
6 1 (0.25%) ZABBIX
Vendors
1 114 (28.08%) Databricks
2 77 (18.97%) Microsoft
3 26 (6.40%) SAP
4 24 (5.91%) Palantir
5 23 (5.67%) Oracle
6 17 (4.19%) Google
7 16 (3.94%) Foundry
8 14 (3.45%) Informatica
9 13 (3.20%) Dell
10 8 (1.97%) NVIDIA
10 8 (1.97%) Splunk
10 8 (1.97%) Talend
11 4 (0.99%) Adobe
11 4 (0.99%) Cisco
11 4 (0.99%) Dataiku
11 4 (0.99%) IBM
12 3 (0.74%) Alteryx
12 3 (0.74%) Salesforce
12 3 (0.74%) Tealium
13 2 (0.49%) Ubiquiti