Open Source Job Trends in England

Open Source
UK > England

The table below provides summary statistics and salary benchmarking for jobs advertised in England requiring Open Source skills. It covers permanent job vacancies from the 6 months leading up to 3 November 2025, with comparisons to the same periods in the previous two years.

6 months to
3 Nov 2025
Same period 2024 Same period 2023
Rank 378 248 258
Rank change year-on-year -130 +10 -84
Permanent jobs citing Open Source 261 667 589
As % of all permanent jobs in England 0.60% 1.10% 1.23%
As % of the Processes & Methodologies category 0.69% 1.32% 1.31%
Number of salaries quoted 157 358 448
10th Percentile £48,099 £46,713 £41,250
25th Percentile £53,750 £53,750 £51,250
Median annual salary (50th Percentile) £73,000 £69,308 £70,000
Median % change year-on-year +5.33% -0.99% -
75th Percentile £89,000 £87,500 £87,125
90th Percentile £121,250 £103,250 £100,750
UK median annual salary £73,159 £69,308 £70,000
% change year-on-year +5.56% -0.99% -

All Process and Methodology Skills
England

Open Source falls under the Processes and Methodologies category. For comparison with the information above, the following table provides summary statistics for all permanent job vacancies requiring process or methodology skills in England.

Permanent vacancies with a requirement for process or methodology skills 38,061 50,374 44,872
As % of all permanent jobs advertised in England 87.31% 82.96% 93.81%
Number of salaries quoted 23,035 26,438 34,456
10th Percentile £28,250 £34,000 £32,500
25th Percentile £36,250 £45,000 £45,000
Median annual salary (50th Percentile) £55,000 £60,000 £60,000
Median % change year-on-year -8.33% - -
75th Percentile £75,000 £80,000 £81,138
90th Percentile £95,000 £98,750 £100,000
UK median annual salary £54,000 £60,000 £60,000
% change year-on-year -10.00% - -

Open Source
Job Vacancy Trend in England

Historical trend showing the proportion of permanent IT job postings citing Open Source relative to all permanent IT jobs advertised in England.
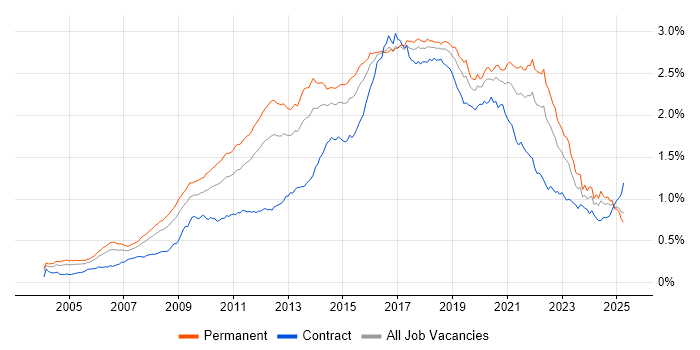
Open Source job vacancy trend in England

Open Source
Salary Trend in England

Salary distribution trend for jobs in England citing Open Source.

Salary distribution trend for jobs in England citing Open Source

Open Source
Salary Histogram in England

Salary distribution for jobs citing Open Source in England over the 6 months to 3 November 2025.

Salary histogram for Open Source in England

Open Source
Job Locations in England

The table below looks at the demand and provides a guide to the median salaries quoted in IT jobs citing Open Source within the England region over the 6 months to 3 November 2025. The 'Rank Change' column provides an indication of the change in demand within each location based on the same 6 month period last year.

Location Rank Change
on Same Period
Last Year
Matching
Permanent
IT Job Ads
Median Salary
Past 6 Months
Median Salary
% Change
on Same Period
Last Year
Live
Jobs
London +26 139 £82,500 -2.94% 265
North of England -109 37 £67,500 +8.00% 53
South East -69 32 £67,500 +10.66% 302
North West -79 24 £71,000 +9.23% 32
East of England +18 19 £30,370 -57.38% 69
Midlands +10 18 £72,500 +10.75% 19
West Midlands +12 11 £72,500 +4.61% 2
South West -15 9 £77,500 +5.08% 47
East Midlands +19 7 £51,058 -7.17% 17
North East +3 7 £52,500 -24.25% 2
Yorkshire -26 6 £64,750 +30.81% 19
Open Source
UK

Open Source
Co-Occurring Skills & Capabilities in England by Category

The following tables expand on the one above by listing co-occurrences grouped by category. They cover the same employment type, locality and period, with up to 20 co-occurrences shown in each category:

Application Platforms
1 17 (6.51%) Apache Spark
2 11 (4.21%) Apache Airflow
3 9 (3.45%) Confluence
4 7 (2.68%) Anypoint
5 4 (1.53%) Apache
5 4 (1.53%) Apache Pulsar
6 3 (1.15%) Kinematics
6 3 (1.15%) OpenStack
7 1 (0.38%) Apache Solr
7 1 (0.38%) Ethereum
7 1 (0.38%) Hyperledger
7 1 (0.38%) IIS
Applications
1 22 (8.43%) Microsoft Office
2 1 (0.38%) Maya
Business Applications
1 8 (3.07%) SAP FS
2 6 (2.30%) Shopify
3 1 (0.38%) Fidessa
3 1 (0.38%) Magento
Cloud Services
1 92 (35.25%) AWS
2 61 (23.37%) Azure
3 46 (17.62%) GCP
4 25 (9.58%) GitHub
4 25 (9.58%) Serverless
5 22 (8.43%) Amazon S3
6 15 (5.75%) PaaS
7 14 (5.36%) AWS Lambda
8 13 (4.98%) Amazon SQS
9 12 (4.60%) Amazon EC2
9 12 (4.60%) AWS CloudFormation
9 12 (4.60%) GitHub Actions
10 11 (4.21%) Amazon CloudWatch
10 11 (4.21%) AWS KMS
10 11 (4.21%) Route 53
11 10 (3.83%) Amazon ECS
11 10 (3.83%) Figma
12 9 (3.45%) dbt
12 9 (3.45%) IaaS
13 8 (3.07%) Amazon OpenSearch
Communications & Networking
1 8 (3.07%) TCP/IP
2 7 (2.68%) Broadband
3 6 (2.30%) Wi-Fi
4 4 (1.53%) Bluetooth
4 4 (1.53%) DHCP
4 4 (1.53%) Wireless
5 3 (1.15%) HTTP
6 2 (0.77%) DNS
6 2 (0.77%) DOCSIS
6 2 (0.77%) DSL
6 2 (0.77%) Firewall
6 2 (0.77%) GPON
6 2 (0.77%) Internet
6 2 (0.77%) IPv4
6 2 (0.77%) IPv6
6 2 (0.77%) PPP
6 2 (0.77%) RTP
6 2 (0.77%) SSL
6 2 (0.77%) VoIP
6 2 (0.77%) WAN
Database & Business Intelligence
1 26 (9.96%) PostgreSQL
2 21 (8.05%) Amazon RDS
3 17 (6.51%) MongoDB
4 15 (5.75%) NoSQL
5 14 (5.36%) DynamoDB
6 13 (4.98%) Relational Database
7 12 (4.60%) MySQL
7 12 (4.60%) Redis
8 11 (4.21%) Amazon Aurora
9 10 (3.83%) Elasticsearch
10 7 (2.68%) SQL Server
11 6 (2.30%) Data Lake
12 5 (1.92%) BigQuery
12 5 (1.92%) RDBMS
12 5 (1.92%) SQL Server Integration Services
13 4 (1.53%) Big Data
13 4 (1.53%) Data Warehouse
13 4 (1.53%) Flink
14 3 (1.15%) Amazon Redshift
14 3 (1.15%) Hadoop
Development Applications
1 38 (14.56%) Git
2 19 (7.28%) JIRA
3 15 (5.75%) Jenkins
4 14 (5.36%) JUnit
5 13 (4.98%) Mockito
6 11 (4.21%) Bitbucket Server
6 11 (4.21%) DbUnit
6 11 (4.21%) jMock
6 11 (4.21%) Maven
6 11 (4.21%) SonarQube
7 10 (3.83%) Bitbucket
7 10 (3.83%) Cypress.io
8 9 (3.45%) Vite
9 8 (3.07%) Selenium
10 5 (1.92%) GitLab
10 5 (1.92%) MLflow
11 4 (1.53%) CircleCI
11 4 (1.53%) KGDB
11 4 (1.53%) rollup.js
12 3 (1.15%) Cucumber
General
1 52 (19.92%) Finance
1 52 (19.92%) Social Skills
2 51 (19.54%) Law
3 41 (15.71%) Analytical Skills
4 37 (14.18%) Inclusion and Diversity
5 27 (10.34%) Public Sector
6 22 (8.43%) Banking
6 22 (8.43%) Legal
7 16 (6.13%) Marketing
8 14 (5.36%) German Language
9 10 (3.83%) French Language
9 10 (3.83%) Games
10 9 (3.45%) Dutch Language
10 9 (3.45%) Retail
11 6 (2.30%) Documentation Skills
12 4 (1.53%) Advertising
12 4 (1.53%) Publishing
13 3 (1.15%) Back Office
13 3 (1.15%) Financial Institution
13 3 (1.15%) Manufacturing
Job Titles
1 80 (30.65%) Senior
2 56 (21.46%) Lead
3 54 (20.69%) Software Engineer
4 36 (13.79%) Developer
5 34 (13.03%) Architect
6 21 (8.05%) Java Engineer
7 20 (7.66%) Java Software Engineer
7 20 (7.66%) Software Architect
8 19 (7.28%) Java Developer
9 18 (6.90%) Lead Software Engineer
10 17 (6.51%) Cloud Engineer
11 16 (6.13%) Platform Engineer
11 16 (6.13%) Senior Software Engineer
12 14 (5.36%) Data Engineer
13 12 (4.60%) Cloud Native Engineer
13 12 (4.60%) Cloud Software Engineer
14 10 (3.83%) Full-Stack Developer
14 10 (3.83%) Senior Developer
15 9 (3.45%) IT Architect
15 9 (3.45%) Lead Architect
Libraries, Frameworks & Software Standards
1 28 (10.73%) Spring
1 28 (10.73%) Spring Boot
2 27 (10.34%) React
3 19 (7.28%) AngularJS
3 19 (7.28%) Hibernate
3 19 (7.28%) RESTful
3 19 (7.28%) Web Services
4 18 (6.90%) Node.js
4 18 (6.90%) REST
5 17 (6.51%) Kafka
5 17 (6.51%) Middleware
6 16 (6.13%) SOAP
7 13 (4.98%) PyTorch
8 12 (4.60%) TensorFlow
9 11 (4.21%) ActiveMQ
9 11 (4.21%) Bootstrap
9 11 (4.21%) HTML
9 11 (4.21%) JSON
9 11 (4.21%) Next.js
9 11 (4.21%) scikit-learn
Miscellaneous
1 56 (21.46%) Cloud Native
2 37 (14.18%) Distributed Systems
3 17 (6.51%) Onboarding
4 12 (4.60%) Data Structures
4 12 (4.60%) Enterprise Software
4 12 (4.60%) Legacy Code
5 11 (4.21%) Algorithms
6 9 (3.45%) Distributed Architecture
7 8 (3.07%) Mobile Banking
8 7 (2.68%) Product Ownership
8 7 (2.68%) Robotics
8 7 (2.68%) Security Posture
9 6 (2.30%) Linux Command Line
9 6 (2.30%) Low-Code
10 5 (1.92%) Mobile App
10 5 (1.92%) Private Cloud
10 5 (1.92%) Virtual Team
11 4 (1.53%) Clustering
11 4 (1.53%) Embedded Systems
11 4 (1.53%) Hybrid Cloud
Operating Systems
1 55 (21.07%) Linux
2 19 (7.28%) Unix
3 5 (1.92%) Windows
4 4 (1.53%) Apple iOS
5 2 (0.77%) OpenWrt
5 2 (0.77%) Ubuntu
6 1 (0.38%) CentOS
6 1 (0.38%) Debian
6 1 (0.38%) Red Hat Enterprise Linux
6 1 (0.38%) Robot Operating System
6 1 (0.38%) Solaris
6 1 (0.38%) Windows 7
6 1 (0.38%) Windows Server
Processes & Methodologies
1 90 (34.48%) Agile
2 88 (33.72%) Software Engineering
3 83 (31.80%) Problem-Solving
4 80 (30.65%) DevOps
5 73 (27.97%) Continuous Improvement
6 69 (26.44%) CI/CD
7 68 (26.05%) AI
8 50 (19.16%) SDLC
9 48 (18.39%) Computer Science
10 47 (18.01%) Mentoring
10 47 (18.01%) Microservices
11 44 (16.86%) Containerisation
12 39 (14.94%) LLM
13 35 (13.41%) Test Automation
14 33 (12.64%) Machine Learning
15 32 (12.26%) TDD
16 31 (11.88%) Generative AI
17 30 (11.49%) Clean Code
17 30 (11.49%) Decision-Making
17 30 (11.49%) Design Patterns
Programming Languages
1 93 (35.63%) Java
2 82 (31.42%) Python
3 45 (17.24%) SQL
4 34 (13.03%) JavaScript
5 28 (10.73%) C++
6 25 (9.58%) Kotlin
7 23 (8.81%) C
8 21 (8.05%) Go
8 21 (8.05%) TypeScript
9 14 (5.36%) Rust
10 9 (3.45%) Bash
10 9 (3.45%) Shell Script
11 7 (2.68%) R
12 6 (2.30%) C#
13 5 (1.92%) T-SQL
14 4 (1.53%) Fortran
14 4 (1.53%) Objective-C
14 4 (1.53%) Scala
14 4 (1.53%) Swift
15 2 (0.77%) Kusto Query Language
Qualifications
1 87 (33.33%) Degree
2 43 (16.48%) Security Cleared
3 34 (13.03%) SC Cleared
4 33 (12.64%) Computer Science Degree
5 21 (8.05%) Master's Degree
6 17 (6.51%) BPSS Clearance
6 17 (6.51%) Chartered Engineer
7 14 (5.36%) DV Cleared
8 10 (3.83%) PhD
9 8 (3.07%) AWS Certification
10 5 (1.92%) AWS Certified Developer
10 5 (1.92%) AWS Certified Solutions Architect
10 5 (1.92%) CISSP
10 5 (1.92%) DBS Check
11 4 (1.53%) Cisco Certification
11 4 (1.53%) CompTIA Security+
11 4 (1.53%) GIAC
12 3 (1.15%) CEH
12 3 (1.15%) CISMP
12 3 (1.15%) Microsoft Certification
Quality Assurance & Compliance
1 20 (7.66%) Accessibility
1 20 (7.66%) QA
2 17 (6.51%) ISO/IEC 12207
3 12 (4.60%) GDPR
4 11 (4.21%) Data Quality
5 8 (3.07%) IFRS
5 8 (3.07%) IFRS 17
5 8 (3.07%) Solvency II
6 6 (2.30%) ISO/IEC 27001
7 5 (1.92%) NIST
7 5 (1.92%) PCI DSS
8 4 (1.53%) WCAG
9 3 (1.15%) Actionable Recommendations
9 3 (1.15%) SLA
9 3 (1.15%) SOC 2
10 2 (0.77%) Cyber Essentials
10 2 (0.77%) NCSC
11 1 (0.38%) NIST 800
System Software
1 67 (25.67%) Docker
2 13 (4.98%) Virtual Machines
3 12 (4.60%) Virtual Servers
4 3 (1.15%) KVM
4 3 (1.15%) Postfix
4 3 (1.15%) QEMU
5 2 (0.77%) Active Directory
Systems Management
1 67 (25.67%) Kubernetes
2 27 (10.34%) Terraform
3 7 (2.68%) Ansible
4 6 (2.30%) AWS Copilot
4 6 (2.30%) Grafana
4 6 (2.30%) Prometheus
5 5 (1.92%) Kubeflow
6 4 (1.53%) Nmap
7 3 (1.15%) Functional Safety
8 2 (0.77%) Kustomize
9 1 (0.38%) Nagios
9 1 (0.38%) Puppet
9 1 (0.38%) WMI
9 1 (0.38%) ZABBIX
Vendors
1 29 (11.11%) Microsoft
2 18 (6.90%) SAP
3 17 (6.51%) Google
4 13 (4.98%) Oracle
5 12 (4.60%) Atlassian
5 12 (4.60%) Informatica
5 12 (4.60%) Talend
6 8 (3.07%) Duck Creek
6 8 (3.07%) Guidewire
7 7 (2.68%) Dell
7 7 (2.68%) Epicor
7 7 (2.68%) IBM
7 7 (2.68%) IFS
7 7 (2.68%) Infor
7 7 (2.68%) Jitterbit
7 7 (2.68%) MuleSoft
7 7 (2.68%) SnapLogic
7 7 (2.68%) Software AG
7 7 (2.68%) TIBCO
7 7 (2.68%) Workday