Splunk Jobs in London

Splunk
England > London

The table below provides summary statistics for permanent job vacancies advertised in London requiring knowledge or experience of Splunk products and/or services. It includes a benchmarking guide to the annual salaries offered in vacancies that cited Splunk over the 6 months leading up to 28 May 2025, comparing them to the same period in the previous two years.

The figures below represent the IT labour market in general and are not representative of salaries within Splunk, Inc.

6 months to
28 May 2025
Same period 2024 Same period 2023
Rank 300 389 318
Rank change year-on-year +89 -71 +28
Permanent jobs citing Splunk 92 123 334
As % of all permanent jobs advertised in London 0.74% 0.52% 1.01%
As % of the Vendors category 1.75% 1.31% 2.55%
Number of salaries quoted 49 94 236
10th Percentile £58,500 £50,075 £51,250
25th Percentile £62,500 £52,500 £60,938
Median annual salary (50th Percentile) £80,000 £72,500 £75,000
Median % change year-on-year +10.34% -3.33% -11.76%
75th Percentile £96,250 £85,315 £87,500
90th Percentile £108,000 £91,991 £99,375
England median annual salary £65,000 £60,000 £70,000
% change year-on-year +8.33% -14.29% -5.72%

All Vendors
London

Splunk falls under the Vendor Products and Services category. For comparison with the information above, the following table provides summary statistics for all permanent job vacancies requiring knowledge or experience of all vendor products and services in London.

Permanent vacancies with a requirement for knowledge or experience of vendor products and services 5,261 9,423 13,076
As % of all permanent jobs advertised in London 42.04% 39.61% 39.47%
Number of salaries quoted 3,066 6,492 9,092
10th Percentile £38,500 £35,500 £37,500
25th Percentile £51,250 £47,500 £50,000
Median annual salary (50th Percentile) £70,000 £67,500 £67,500
Median % change year-on-year +3.70% - +3.85%
75th Percentile £90,000 £87,500 £87,500
90th Percentile £110,000 £106,250 £103,750
England median annual salary £55,000 £50,000 £57,500
% change year-on-year +10.00% -13.04% +4.55%

Splunk
Job Vacancy Trend in London

Job postings citing Splunk as a proportion of all IT jobs advertised in London.
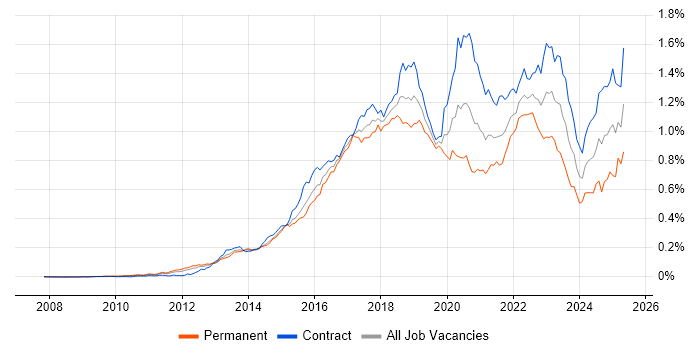
Job vacancy trend for Splunk in London

Splunk
Salary Trend in London

3-month moving average salary quoted in jobs citing Splunk in London.

Salary trend for Splunk in London

Splunk
Salary Histogram in London

Salary distribution for jobs citing Splunk in London over the 6 months to 28 May 2025.

Salary histogram for Splunk in London

Splunk
Job Locations in London

The table below looks at the demand and provides a guide to the median salaries quoted in IT jobs citing Splunk within the London region over the 6 months to 28 May 2025. The 'Rank Change' column provides an indication of the change in demand within each location based on the same 6 month period last year.

Location Rank Change
on Same Period
Last Year
Matching
Permanent
IT Job Ads
Median Salary
Past 6 Months
Median Salary
% Change
on Same Period
Last Year
Live
Jobs
South London +7 16 £65,000 +6.47% 4
Central London +35 13 £90,000 +24.14% 7
East London - 2 £100,000 - 1
Splunk
England

Splunk
Co-occurring Skills and Capabilities in London by Category

The follow tables expand on the table above by listing co-occurrences grouped by category. The same employment type, locality and period is covered with up to 20 co-occurrences shown in each of the following categories:

Application Platforms
1 4 (4.35%) Microsoft Exchange
2 3 (3.26%) Confluence
2 3 (3.26%) nginx
3 2 (2.17%) GemFire
4 1 (1.09%) Apache
4 1 (1.09%) Apache Airflow
Business Applications
1 1 (1.09%) Aladdin
1 1 (1.09%) thinkFolio
Cloud Services
1 50 (54.35%) AWS
2 32 (34.78%) Azure
3 21 (22.83%) Amazon ECS
3 21 (22.83%) Serverless
4 15 (16.30%) Amazon EKS
5 14 (15.22%) Amazon EC2
5 14 (15.22%) GCP
6 12 (13.04%) Azure Monitor
7 9 (9.78%) GitHub
8 8 (8.70%) Amazon CloudWatch
8 8 (8.70%) Azure Sentinel
8 8 (8.70%) SaaS
9 7 (7.61%) Datadog
10 5 (5.43%) Entra ID
11 4 (4.35%) Amazon ECR
11 4 (4.35%) AWS Lambda
11 4 (4.35%) Azure DevOps
11 4 (4.35%) Azure Functions
11 4 (4.35%) BlazeMeter
11 4 (4.35%) Rubrik
Communications & Networking
1 11 (11.96%) Firewall
2 9 (9.78%) Network Security
3 5 (5.43%) Intrusion Detection
3 5 (5.43%) Kerberos
3 5 (5.43%) VPN
4 4 (4.35%) Unified Communications
5 3 (3.26%) DNS
6 2 (2.17%) NAS
6 2 (2.17%) SAN
6 2 (2.17%) SNMP
6 2 (2.17%) Wireshark
7 1 (1.09%) DHCP
7 1 (1.09%) SSL
7 1 (1.09%) TCP/IP
Database & Business Intelligence
1 15 (16.30%) PostgreSQL
2 13 (14.13%) Relational Database
3 12 (13.04%) RDBMS
4 7 (7.61%) Elasticsearch
5 5 (5.43%) MySQL
6 4 (4.35%) MongoDB
6 4 (4.35%) SQL Server
7 3 (3.26%) Amazon Athena
7 3 (3.26%) DynamoDB
8 2 (2.17%) Amazon RDS
8 2 (2.17%) Big Data
8 2 (2.17%) Electronic Patient Records
8 2 (2.17%) Oracle Database
8 2 (2.17%) Power BI
8 2 (2.17%) Redis
9 1 (1.09%) Amazon Aurora
9 1 (1.09%) Apache Iceberg
9 1 (1.09%) Data Warehouse
9 1 (1.09%) NoSQL
Development Applications
1 32 (34.78%) Jenkins
2 15 (16.30%) JUnit
3 14 (15.22%) Git
3 14 (15.22%) Mockito
4 13 (14.13%) JMeter
5 10 (10.87%) GitLab
5 10 (10.87%) JIRA
6 5 (5.43%) Atlassian Bamboo
6 5 (5.43%) Maven
7 4 (4.35%) Bitbucket
7 4 (4.35%) Postman
8 3 (3.26%) REST Assured
8 3 (3.26%) SoapUI
8 3 (3.26%) SonarQube
9 2 (2.17%) Cucumber
9 2 (2.17%) Gradle
9 2 (2.17%) Subversion
9 2 (2.17%) Xcode
9 2 (2.17%) XCTest
10 1 (1.09%) Metasploit
General
1 31 (33.70%) Finance
2 30 (32.61%) Social Skills
3 18 (19.57%) Public Sector
4 13 (14.13%) Analytical Skills
5 11 (11.96%) Banking
6 6 (6.52%) Law
7 4 (4.35%) Inclusion and Diversity
7 4 (4.35%) Marketing
7 4 (4.35%) Presentation Skills
8 2 (2.17%) Military
9 1 (1.09%) Back Office
9 1 (1.09%) Documentation Skills
9 1 (1.09%) Financial Institution
9 1 (1.09%) Influencing Skills
9 1 (1.09%) Investment Banking
9 1 (1.09%) Telecoms
Job Titles
1 18 (19.57%) Senior
2 15 (16.30%) Analyst
3 14 (15.22%) Developer
4 13 (14.13%) Java Developer
5 11 (11.96%) DevOps Engineer
6 6 (6.52%) Applications Support
6 6 (6.52%) Cloud Engineer
6 6 (6.52%) Security Analyst
7 5 (5.43%) Architect
7 5 (5.43%) Full-Stack Developer
7 5 (5.43%) Identity and Access Management Engineer
7 5 (5.43%) Identity Management Engineer
7 5 (5.43%) Security Engineer
7 5 (5.43%) Senior Analyst
7 5 (5.43%) Site Engineer
7 5 (5.43%) Site Reliability Engineer
7 5 (5.43%) Software Engineer
8 4 (4.35%) Full-Stack Java Developer
8 4 (4.35%) Lead
8 4 (4.35%) Senior DevOps
Libraries, Frameworks & Software Standards
1 17 (18.48%) Spring
2 16 (17.39%) REST
2 16 (17.39%) Spring Boot
3 15 (16.30%) HTML
4 14 (15.22%) Hibernate
4 14 (15.22%) Web Services
5 12 (13.04%) ActiveMQ
5 12 (13.04%) Apache Camel
5 12 (13.04%) jQuery
5 12 (13.04%) WireMock
6 8 (8.70%) Elastic Stack
7 6 (6.52%) Kafka
7 6 (6.52%) OAuth
7 6 (6.52%) SailPoint
8 5 (5.43%) LDAP
8 5 (5.43%) OpenID
8 5 (5.43%) SAML
9 4 (4.35%) JSON
9 4 (4.35%) XML
9 4 (4.35%) YAML
Miscellaneous
1 16 (17.39%) Distributed Systems
2 7 (7.61%) Cyber Threat
2 7 (7.61%) Data Centre
2 7 (7.61%) Onboarding
3 5 (5.43%) Cloud Native
3 5 (5.43%) PKI
4 4 (4.35%) Cyber Defence
4 4 (4.35%) Data Protection Act
5 3 (3.26%) Equities
5 3 (3.26%) Security Posture
6 2 (2.17%) Analytical Mindset
6 2 (2.17%) Foreign Exchange (FX)
6 2 (2.17%) Security Operations Centre
7 1 (1.09%) Algorithms
7 1 (1.09%) Cyber Kill Chain
7 1 (1.09%) Data Structures
7 1 (1.09%) Mainframe
7 1 (1.09%) NHS
7 1 (1.09%) Public Cloud
7 1 (1.09%) SWIFT Messaging Network
Operating Systems
1 23 (25.00%) Linux
2 18 (19.57%) Windows
3 15 (16.30%) Windows Server
4 12 (13.04%) Unix
5 4 (4.35%) CentOS
6 2 (2.17%) Windows Server 2016
7 1 (1.09%) Android
7 1 (1.09%) Mac OS
Processes & Methodologies
1 41 (44.57%) CI/CD
2 34 (36.96%) SIEM
3 32 (34.78%) Agile
4 30 (32.61%) DevOps
5 23 (25.00%) Problem-Solving
6 20 (21.74%) Microservices
7 18 (19.57%) Incident Response
8 17 (18.48%) Infrastructure as Code
9 16 (17.39%) Containerisation
9 16 (17.39%) Scrum
9 16 (17.39%) TDD
9 16 (17.39%) Workflow
10 15 (16.30%) Cybersecurity
11 14 (15.22%) Architectural Design
11 14 (15.22%) Collaborative Working
11 14 (15.22%) Continuous Improvement
12 13 (14.13%) BDD
13 12 (13.04%) Process Management
14 11 (11.96%) Capacity Planning
14 11 (11.96%) Disaster Recovery
Programming Languages
1 50 (54.35%) Python
2 25 (27.17%) PowerShell
3 24 (26.09%) Java
4 22 (23.91%) Shell Script
5 16 (17.39%) JavaScript
5 16 (17.39%) SQL
6 15 (16.30%) Bash
7 7 (7.61%) Go
8 4 (4.35%) Kusto Query Language
8 4 (4.35%) PL/SQL
8 4 (4.35%) Ruby
8 4 (4.35%) Search Processing Language
9 3 (3.26%) Gremlin
9 3 (3.26%) Groovy
10 1 (1.09%) C
10 1 (1.09%) C++
10 1 (1.09%) Scala
Qualifications
1 23 (25.00%) Security Cleared
2 19 (20.65%) SC Cleared
3 9 (9.78%) Microsoft Certification
4 8 (8.70%) CISSP
5 6 (6.52%) CISM
6 5 (5.43%) Degree
7 4 (4.35%) Azure Certification
7 4 (4.35%) CCNA
7 4 (4.35%) CCNP
7 4 (4.35%) Cisco Certification
8 3 (3.26%) DV Cleared
8 3 (3.26%) Master's Degree
9 2 (2.17%) AWS Certified Solutions Architect
9 2 (2.17%) CEH
9 2 (2.17%) CompTIA Security+
9 2 (2.17%) Computer Science Degree
9 2 (2.17%) GCFA
9 2 (2.17%) GCIH
9 2 (2.17%) ISTQB
9 2 (2.17%) SANS
Quality Assurance & Compliance
1 8 (8.70%) NIST
2 7 (7.61%) ISO/IEC 27001
2 7 (7.61%) SLA
3 5 (5.43%) GDPR
4 4 (4.35%) Cyber Essentials
4 4 (4.35%) NCSC
4 4 (4.35%) QA
5 2 (2.17%) Cyber Essentials PLUS
5 2 (2.17%) HIPAA
5 2 (2.17%) SOC 2
System Software
1 34 (36.96%) Docker
2 9 (9.78%) Active Directory
3 7 (7.61%) VMware Infrastructure
4 4 (4.35%) EMC RecoverPoint
5 3 (3.26%) Hyper-V
Systems Management
1 34 (36.96%) Kubernetes
2 33 (35.87%) Grafana
3 23 (25.00%) Terraform
4 18 (19.57%) Ansible
4 18 (19.57%) Prometheus
5 15 (16.30%) Kibana
6 8 (8.70%) Progress Chef
7 7 (7.61%) Nagios
8 6 (6.52%) Single Sign-On
9 5 (5.43%) QRadar
10 4 (4.35%) Cisco CUCM
10 4 (4.35%) VxRail
11 3 (3.26%) Active Directory Federation Services
11 3 (3.26%) Nessus
12 2 (2.17%) HAProxy
12 2 (2.17%) Istio
12 2 (2.17%) linkerd
13 1 (1.09%) CSIRT
13 1 (1.09%) ITRS Geneos
13 1 (1.09%) Microsoft Intune
Vendors
1 23 (25.00%) Dynatrace
1 23 (25.00%) Microsoft
2 10 (10.87%) Oracle
2 10 (10.87%) VMware
3 5 (5.43%) Google
3 5 (5.43%) SolarWinds
4 4 (4.35%) Cisco
4 4 (4.35%) CrowdStrike
4 4 (4.35%) Rapid7
4 4 (4.35%) Red Hat
4 4 (4.35%) Sophos
4 4 (4.35%) Zscaler
5 3 (3.26%) CheckPoint
5 3 (3.26%) Commvault
5 3 (3.26%) Tenable
6 2 (2.17%) ESRI
6 2 (2.17%) F5
6 2 (2.17%) FireEye
6 2 (2.17%) ServiceNow
6 2 (2.17%) TIBCO