Support Engineer Jobs in London

Support Engineer
England > London

The median Support Engineer salary in London is £39,000 per year, according to job vacancies posted during the 6 months leading to 16 July 2025.

The table below provides salary benchmarking and summary statistics, comparing them to the same period in the previous two years.

6 months to
16 Jul 2025
Same period 2024 Same period 2023
Rank 151 215 161
Rank change year-on-year +64 -54 +220
Permanent jobs requiring a Support Engineer 306 358 646
As % of all permanent jobs advertised in London 2.33% 1.54% 2.23%
As % of the Job Titles category 2.54% 1.63% 2.35%
Number of salaries quoted 212 285 573
10th Percentile £30,000 £27,800 £29,350
25th Percentile £33,250 £32,500 £31,250
Median annual salary (50th Percentile) £39,000 £40,000 £37,500
Median % change year-on-year -2.50% +6.67% -2.60%
75th Percentile £53,750 £47,500 £47,500
90th Percentile £68,750 £66,750 £71,250
England median annual salary £37,500 £32,500 £33,500
% change year-on-year +15.38% -2.99% -1.47%

All Permanent IT Job Vacancies
London

For comparison with the information above, the following table provides summary statistics for all permanent IT job vacancies in London. Most job vacancies include a discernible job title that can be normalized. As such, the figures in the second row provide an indication of the number of permanent jobs in our overall sample.

Permanent vacancies in London with a recognized job title 12,033 21,986 27,482
% of permanent jobs with a recognized job title 91.62% 94.37% 95.00%
Number of salaries quoted 7,404 15,933 21,585
10th Percentile £40,000 £37,500 £41,250
25th Percentile £53,750 £50,000 £53,750
Median annual salary (50th Percentile) £72,500 £70,000 £72,500
Median % change year-on-year +3.57% -3.45% +3.57%
75th Percentile £97,500 £93,750 £95,000
90th Percentile £120,000 £115,000 £115,000
England median annual salary £55,000 £52,900 £60,000
% change year-on-year +3.97% -11.83% -

Support Engineer
Job Vacancy Trend in London

Job postings that featured Support Engineer in the job title as a proportion of all IT jobs advertised in London.
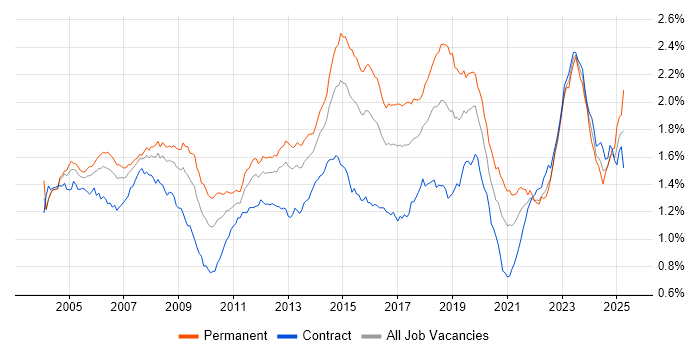
Job vacancy trend for Support Engineer in London

Support Engineer
Salary Trend in London

3-month moving average salary quoted in jobs citing Support Engineer in London.

Salary trend for Support Engineer in London

Support Engineer
Salary Histogram in London

Salary distribution for jobs citing Support Engineer in London over the 6 months to 16 July 2025.

Salary histogram for Support Engineer in London

Support Engineer
Job Locations in London

The table below looks at the demand and provides a guide to the median salaries quoted in IT jobs citing Support Engineer within the London region over the 6 months to 16 July 2025. The 'Rank Change' column provides an indication of the change in demand within each location based on the same 6 month period last year.

Location Rank Change
on Same Period
Last Year
Matching
Permanent
IT Job Ads
Median Salary
Past 6 Months
Median Salary
% Change
on Same Period
Last Year
Live
Jobs
Central London -23 45 £35,750 -15.88% 21
South London +37 44 £51,500 +51.47% 5
West London +24 31 £42,250 +30.00% 10
East London -2 13 £39,000 +4.00% 5
North London -14 7 - - 1
Support Engineer
England

Support Engineer Skill Set
Top 30 Co-occurring Skills and Capabilities in London

For the 6 months to 16 July 2025, Support Engineer job roles required the following skills and capabilities in order of popularity. The figures indicate the absolute number co-occurrences and as a proportion of all permanent job ads across the London region featuring Support Engineer in the job title.

1 208 (67.97%) Microsoft
2 187 (61.11%) Windows
3 182 (59.48%) Social Skills
4 175 (57.19%) Active Directory
5 107 (34.97%) Degree
6 102 (33.33%) Azure
7 99 (32.35%) Microsoft 365
8 79 (25.82%) Problem-Solving
9 78 (25.49%) Proactive Monitoring
10 74 (24.18%) Customer Service
11 70 (22.88%) Windows Server 2012
12 69 (22.55%) Sun
13 68 (22.22%) Proactive Maintenance
14 67 (21.90%) Broadcast Engineering
14 67 (21.90%) Post-Production
14 67 (21.90%) Procure-to-Pay
14 67 (21.90%) Coaching
14 67 (21.90%) Broadband
15 60 (19.61%) Windows Server
16 47 (15.36%) SharePoint
17 44 (14.38%) SQL
17 44 (14.38%) Firewall
18 43 (14.05%) ITIL
19 40 (13.07%) AWS
20 39 (12.75%) Entra ID
20 39 (12.75%) Microsoft Intune
21 36 (11.76%) Wi-Fi
22 34 (11.11%) Continuous Improvement
22 34 (11.11%) Windows 10
23 32 (10.46%) Finance

Support Engineer Skill Set
Co-occurring Skills and Capabilities in London by Category

The follow tables expand on the table above by listing co-occurrences grouped by category. The same employment type, locality and period is covered with up to 20 co-occurrences shown in each of the following categories:

Application Platforms
1 47 (15.36%) SharePoint
2 20 (6.54%) Microsoft Exchange
3 12 (3.92%) Confluence
4 5 (1.63%) Kinematics
5 3 (0.98%) IIS
6 1 (0.33%) Exchange Server 2010
6 1 (0.33%) WordPress
Applications
1 23 (7.52%) Microsoft Office
2 12 (3.92%) Microsoft Excel
3 8 (2.61%) SOLIDWORKS
4 7 (2.29%) Chatbot
5 3 (0.98%) Microsoft PowerPoint
6 1 (0.33%) Adobe Creative Suite
6 1 (0.33%) MS Visio
6 1 (0.33%) Notion
Business Applications
1 1 (0.33%) Eikon
1 1 (0.33%) Elite 3E
Cloud Services
1 102 (33.33%) Azure
2 99 (32.35%) Microsoft 365
3 40 (13.07%) AWS
4 39 (12.75%) Entra ID
5 28 (9.15%) OneDrive
6 22 (7.19%) SaaS
7 13 (4.25%) Mimecast
8 12 (3.92%) GCP
9 10 (3.27%) Azure DevOps
9 10 (3.27%) Azure Monitor
10 9 (2.94%) Google Workspace
11 7 (2.29%) IaaS
12 6 (1.96%) Azure Sentinel
12 6 (1.96%) Power Platform
13 5 (1.63%) Azure App Service
14 4 (1.31%) Amazon EC2
14 4 (1.31%) Azure Storage
14 4 (1.31%) Azure Table
14 4 (1.31%) Serverless
14 4 (1.31%) Slack
Communications & Networking
1 67 (21.90%) Broadband
2 44 (14.38%) Firewall
3 36 (11.76%) Wi-Fi
4 23 (7.52%) DNS
4 23 (7.52%) LAN
5 19 (6.21%) TCP/IP
5 19 (6.21%) WAN
6 18 (5.88%) VPN
7 16 (5.23%) DHCP
8 11 (3.59%) Internet
9 8 (2.61%) VLAN
9 8 (2.61%) Wireless
10 5 (1.63%) PBX
10 5 (1.63%) Structured Cabling
11 4 (1.31%) VoIP
12 3 (0.98%) Cisco ASA
13 2 (0.65%) 4G
13 2 (0.65%) Cisco IOS
13 2 (0.65%) SAN
13 2 (0.65%) WebEx
Database & Business Intelligence
1 8 (2.61%) Relational Database
1 8 (2.61%) SQL Server
2 5 (1.63%) NoSQL
3 3 (0.98%) Azure SQL Database
3 3 (0.98%) PostgreSQL
4 2 (0.65%) Azure SQL Data Warehouse
4 2 (0.65%) Data Lake
4 2 (0.65%) Data Warehouse
4 2 (0.65%) Elasticsearch
4 2 (0.65%) Power BI
5 1 (0.33%) Apache Cassandra
5 1 (0.33%) DB2
5 1 (0.33%) JasperReports
5 1 (0.33%) Oracle Reports
5 1 (0.33%) Tableau
Development Applications
1 15 (4.90%) JIRA
2 5 (1.63%) GitLab
2 5 (1.63%) SonarQube
2 5 (1.63%) Sonatype Nexus
3 4 (1.31%) Git
4 1 (0.33%) Bitbucket
4 1 (0.33%) Fiddler
General
1 182 (59.48%) Social Skills
2 32 (10.46%) Finance
3 25 (8.17%) Analytical Skills
4 13 (4.25%) Inclusion and Diversity
5 11 (3.59%) Banking
6 10 (3.27%) Front Office
7 9 (2.94%) Advertising
7 9 (2.94%) Manufacturing
7 9 (2.94%) Organisational Skills
8 8 (2.61%) Aeronautics
8 8 (2.61%) Aerospace
8 8 (2.61%) Aviation
9 6 (1.96%) Back Office
10 5 (1.63%) French Language
10 5 (1.63%) German Language
10 5 (1.63%) Legal
10 5 (1.63%) Marketing
11 4 (1.31%) Retail
12 3 (0.98%) Games
12 3 (0.98%) Telecoms
Libraries, Frameworks & Software Standards
1 12 (3.92%) 802.1X
2 6 (1.96%) REST
3 4 (1.31%) FIX Protocol
4 2 (0.65%) Elastic Stack
5 1 (0.33%) Express.js
5 1 (0.33%) Microsoft Graph
5 1 (0.33%) Node.js
5 1 (0.33%) OAuth
5 1 (0.33%) OpenID
5 1 (0.33%) React
5 1 (0.33%) SAML
5 1 (0.33%) Web Services
5 1 (0.33%) X-Windows
Miscellaneous
1 23 (7.52%) Self-Motivation
2 18 (5.88%) iPhone
3 11 (3.59%) Hybrid Cloud
4 10 (3.27%) Video Conferencing
5 9 (2.94%) Fat Client
5 9 (2.94%) Linux Command Line
5 9 (2.94%) Thin Client
6 8 (2.61%) Public Cloud
7 7 (2.29%) CCTV
7 7 (2.29%) Driving Licence
7 7 (2.29%) Onboarding
8 6 (1.96%) Data Centre
9 5 (1.63%) Distributed Computing
9 5 (1.63%) Foreign Exchange (FX)
9 5 (1.63%) Smartphone
10 4 (1.31%) Equities
10 4 (1.31%) Fibre Optics
10 4 (1.31%) iPad
11 3 (0.98%) Hedge funds
12 2 (0.65%) Enterprise Software
Operating Systems
1 187 (61.11%) Windows
2 70 (22.88%) Windows Server 2012
3 60 (19.61%) Windows Server
4 34 (11.11%) Windows 10
5 29 (9.48%) Linux
6 16 (5.23%) Mac OS
7 9 (2.94%) Windows Server 2016
8 6 (1.96%) Apple iOS
9 4 (1.31%) Android
9 4 (1.31%) Windows Server 2019
10 3 (0.98%) Windows 7
10 3 (0.98%) Windows Server 2008
11 2 (0.65%) Mac OS X
11 2 (0.65%) Unix
Processes & Methodologies
1 79 (25.82%) Problem-Solving
2 78 (25.49%) Proactive Monitoring
3 74 (24.18%) Customer Service
4 68 (22.22%) Proactive Maintenance
5 67 (21.90%) Broadcast Engineering
5 67 (21.90%) Coaching
5 67 (21.90%) Post-Production
5 67 (21.90%) Procure-to-Pay
6 43 (14.05%) ITIL
7 34 (11.11%) Continuous Improvement
8 20 (6.54%) Service Management
9 18 (5.88%) DevOps
9 18 (5.88%) High Availability
10 17 (5.56%) Infrastructure Engineering
11 16 (5.23%) Asset Management
11 16 (5.23%) CI/CD
12 15 (4.90%) Mobile Device Management
12 15 (4.90%) Password Management
13 14 (4.58%) B2B
13 14 (4.58%) Change Management
Programming Languages
1 44 (14.38%) SQL
2 29 (9.48%) PowerShell
3 22 (7.19%) Python
4 14 (4.58%) Bash
5 13 (4.25%) C#
6 8 (2.61%) VB
7 7 (2.29%) Shell Script
8 5 (1.63%) Java
9 3 (0.98%) VBA
10 1 (0.33%) JavaScript
10 1 (0.33%) TypeScript
Qualifications
1 107 (34.97%) Degree
2 11 (3.59%) Microsoft Certification
3 8 (2.61%) Azure Certification
3 8 (2.61%) Security Cleared
4 3 (0.98%) A+ Certification
4 3 (0.98%) AWS Certification
4 3 (0.98%) Cisco Certification
4 3 (0.98%) ITIL Foundation Certificate
5 2 (0.65%) Computer Science Degree
5 2 (0.65%) HNC
5 2 (0.65%) HND
5 2 (0.65%) ITIL Certification
6 1 (0.33%) CCENT
6 1 (0.33%) CCNA
6 1 (0.33%) CCNP
6 1 (0.33%) DBS Check
6 1 (0.33%) JNCIP
6 1 (0.33%) MCSA
6 1 (0.33%) Network+ Certification
6 1 (0.33%) PhD
Quality Assurance & Compliance
1 14 (4.58%) SLA
2 7 (2.29%) Cyber Essentials
3 4 (1.31%) ISO/IEC 27001
4 3 (0.98%) Accessibility
5 2 (0.65%) Cyber Essentials PLUS
5 2 (0.65%) ISO 9001
5 2 (0.65%) QA
System Software
1 175 (57.19%) Active Directory
2 13 (4.25%) Hyper-V
3 12 (3.92%) XenApp
4 7 (2.29%) Docker
5 6 (1.96%) VMware Infrastructure
6 4 (1.31%) Virtual Desktop
7 3 (0.98%) XenDesktop
8 2 (0.65%) Virtual Servers
8 2 (0.65%) VMware ESXi
8 2 (0.65%) VMware Workstation
9 1 (0.33%) BitLocker
9 1 (0.33%) Firmware
9 1 (0.33%) Microsoft Virtual Server
9 1 (0.33%) Virtual Machines
9 1 (0.33%) vSphere
Systems Management
1 39 (12.75%) Microsoft Intune
2 24 (7.84%) SCCM
3 20 (6.54%) Terraform
4 9 (2.94%) Kubernetes
5 8 (2.61%) Ansible
6 7 (2.29%) Active Directory Federation Services
7 4 (1.31%) Single Sign-On
8 3 (0.98%) Control-M
9 2 (0.65%) Kibana
9 2 (0.65%) logstash
10 1 (0.33%) Jamf Pro
10 1 (0.33%) Plesk
Vendors
1 208 (67.97%) Microsoft
2 69 (22.55%) Sun
3 23 (7.52%) ServiceNow
4 22 (7.19%) Cisco
5 19 (6.21%) Citrix
5 19 (6.21%) Google
6 14 (4.58%) Apple
7 11 (3.59%) Dell
8 10 (3.27%) SAP
9 9 (2.94%) VMware
10 8 (2.61%) Databricks
10 8 (2.61%) HP
10 8 (2.61%) Meraki
11 6 (1.96%) Bloomberg
12 5 (1.63%) Polycom
12 5 (1.63%) Siemens
13 3 (0.98%) CheckPoint
13 3 (0.98%) Red Hat
13 3 (0.98%) SolarWinds
13 3 (0.98%) Zscaler